
Fig. 1.
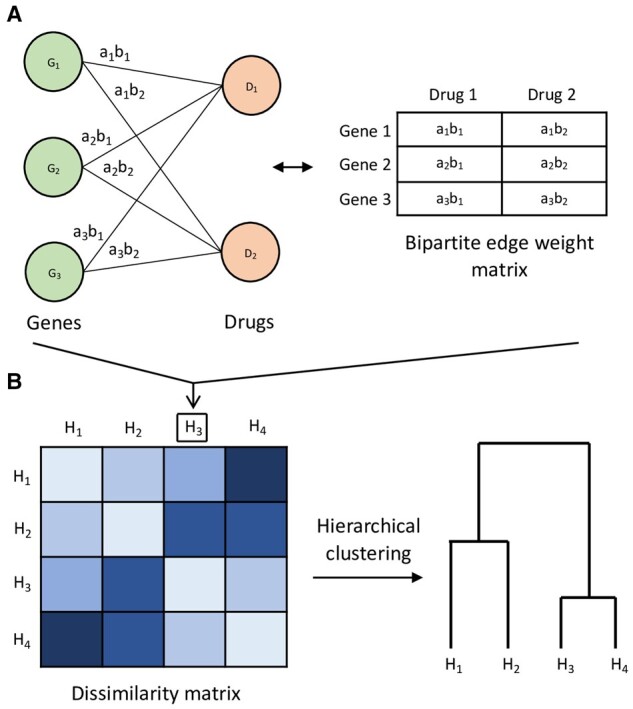
Overview of proposed approach illustrated with toy example of cell line groups , each with genes and drugs D1, D2. (A) For example cell line group H3, its gene–drug association patterns are modeled as a bipartite graph of gene vertices and drug vertices, with edges weighted by association strength. The edge weight between gene i and drug j is defined as , where ai, bj are elements of SCCA canonical vectors and . The bipartite graph can equivalently be represented by its edge weight matrix. This modeling of gene–drug association patterns is repeated for . (B) Using the nuclear norm-based dissimilarity measure between bipartite graphs, a matrix of dissimilarities is computed for all the cell line groups, and hierarchical clustering can be applied as an example unsupervised analysis