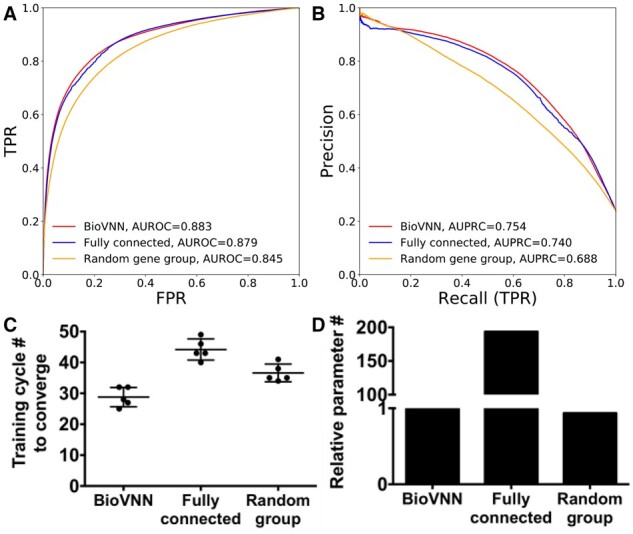
Fig. 2.

BioVNN predicts the dependency for genes with potential druggability. (A) The receiver operating characteristic (ROC) curve and (B) precision–recall (PR) curve of BioVNN based on Reactome pathways, the FCN and the matched randomized NN which matches the architecture but with shuffled gene–pathway relationship (random gene groups). The AUROC and the AUPRC were used as the performance metrics (see Section 2). (C) The number of training cycles (i.e. epochs) required for the three networks to converge. (D) The relative number of trainable parameters of three networks
