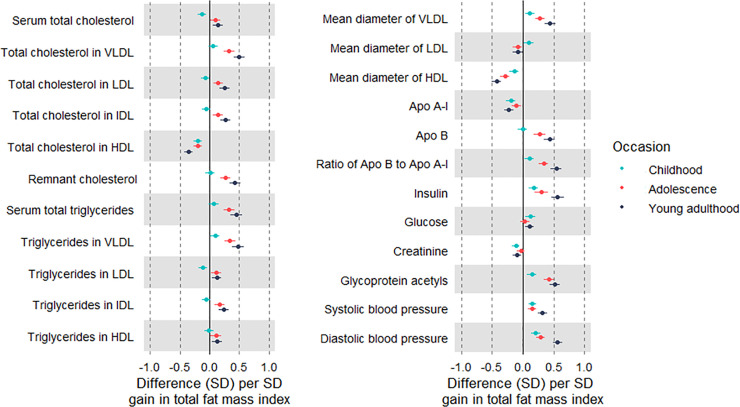
Fig 6. Associations of change in fat mass index at different life stages with cardiometabolic traits at 25 y among Avon Longitudinal Study of Parents and Children Generation 1 individuals.
Estimates are beta coefficients and 95% CIs representing SD-unit differences in cardiometabolic traits at 25 y per SD-unit gain in total fat mass index in childhood (based on standardised index at 13 y minus standardised index at 10 y), adolescence (based on standardised index at 18 y minus standardised index at 13 y), and young adulthood (based on standardised index at 25 y minus standardised index at 18 y). Models adjusted for age, sex, ethnicity, maternal education, initial fat mass index, and change in limb lean mass index; models of adolescence additionally adjusted for puberty timing, and models for young adulthood additionally adjusted for puberty timing and smoking and alcohol at 18 y (N range: 1,532 to 2,804). Apo, apolipoprotein; LDL, low-density lipoprotein; HDL, high-density lipoprotein; IDL, intermediate-density lipoprotein; VLDL, very-low-density lipoprotein.

