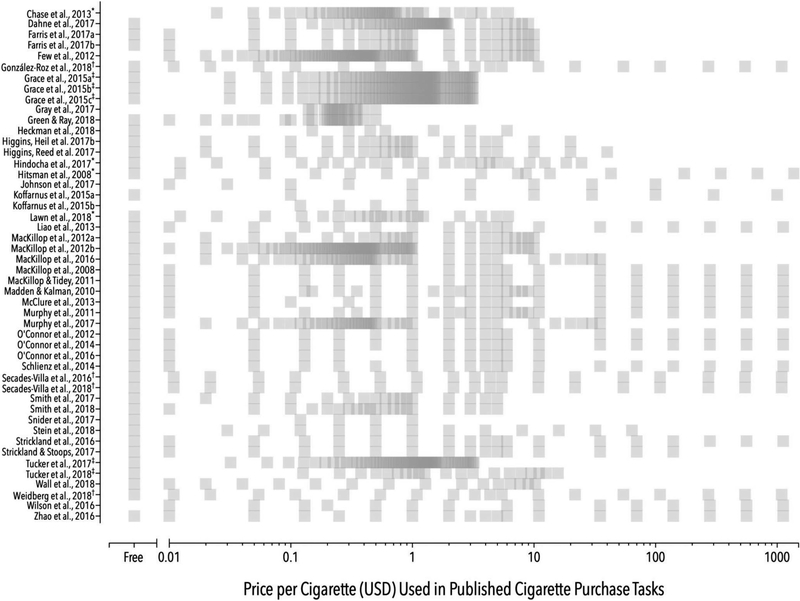
Figure 2.
Distribution plot of prices (in U.S. dollars, plotted along the x-axis on a logarithmic scale) assessed in each of the published cigarette purchase tasks (CPTs) included in this review (organized alphabetically along the y-axis). Semitransparent gray boxes represent inclusion of associated prices in the CPT. * = converted from British pounds; † = converted from Euros; ‡ = converted from New Zealand dollars.

