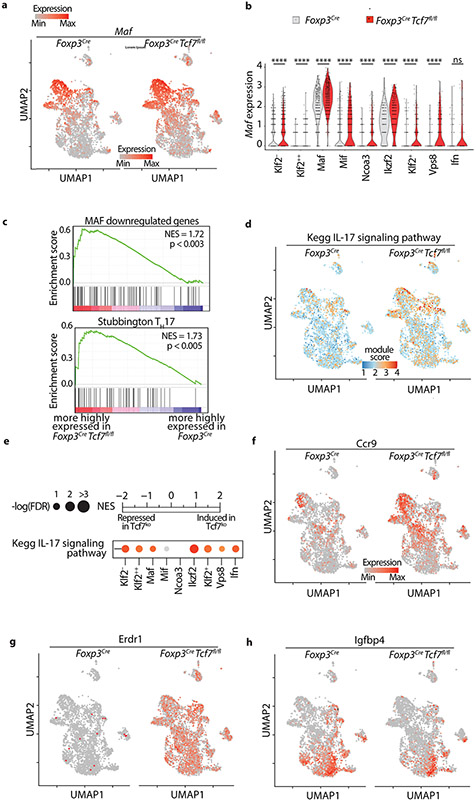
Extended Data Fig. 5. TCF-1-deficient and sufficient Treg-cells show distinct effector functions.
Treg-cells were isolated from the mesenteric lymph nodes of Foxp3Cre and Tcf7fl/flFoxp3Cre mice. (a) mRNA expression of Maf projected on the UMAP, comparing Treg-cells derived from Foxp3Cre to Tcf7fl/fl Foxp3Cre mice. (b) Violin plots showing expression of Maf in individual Treg clusters. (c) GSEA of MAF downregulated genes and TH17 pathway defined by Stubbington. (d) Kegg IL17 signaling pathway projected on UMAP, comparing TCF-1-sufficient and TCF-1-deficient Treg-cells (e) GSEA analysis for the Kegg IL17 signaling pathway comparing transcriptomes of TCF-1-sufficient and TCF-1-deficient Treg-cells across all cell types. Normalized enrichment scores (NES) are color coded. −log10 (FDR) values are proportional to the circle size. FDR>15% are masked with gray color. (fgh) mRNA expression of Ccr9, Erdr1 and Igfbp4 projected on the UMAP, comparing TCF-1-sufficient and TCF-1-deficient Klf2− cells for the Kegg IL17 pathway.

