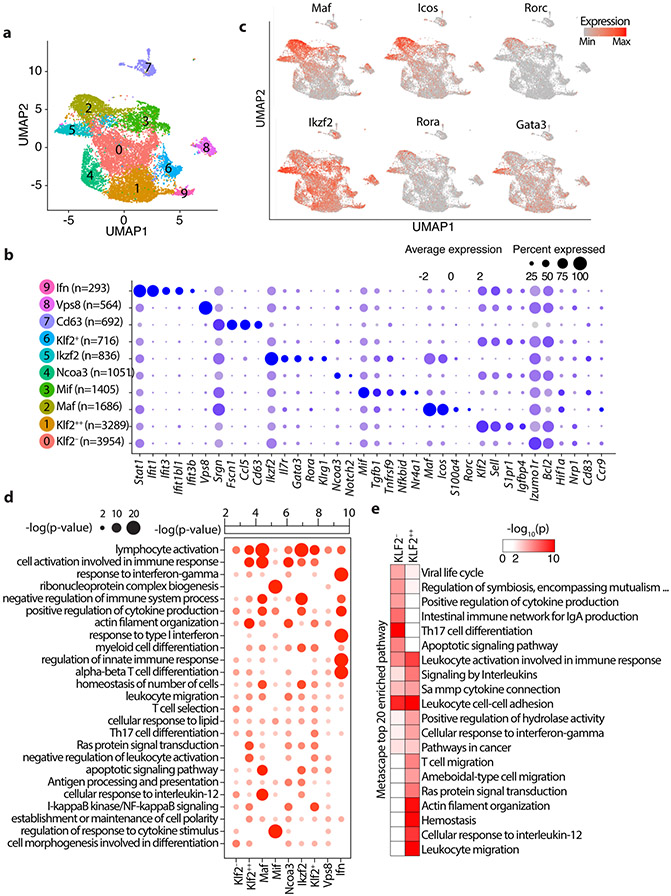
Figure 3: Single cell transcriptomics delineates distinct Treg subpopulations in the mesenteric lymph nodes.
(a) Integrated UMAP showing 10 major Treg cell types isolated from the MLNs of mice used in this study. (b) Expression of cell-defining features across all cell types. Color intensity is proportional to the average of gene expression across cells in the indicated clusters. The size of circles is proportional to percentage of cells expressing indicated genes. (c) mRNA expression of select indicated genes projected on the UMAP, focusing on features of the Maf and Ikzf2 Treg clusters. (d) Significantly enriched pathways by Metascape based on top 200 genes upregulated in indicated cell type compared to all other cell types. See TableS2 for the full list. (e) 20 most significantly enriched pathways by Metascape based on genes upregulated in Klf2− or Klf2++ cell types compared directly to Klf2++ or Klf2− cell types, respectively.

