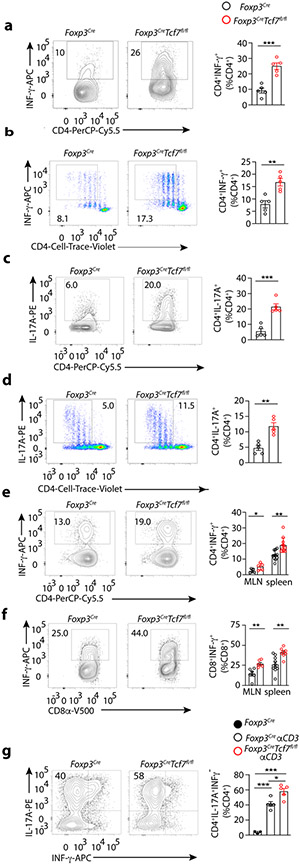
Figure 6: TCF-1-deficient Treg-cells fail to suppress TH1 or TH17 polarization of CD4+ Tconv cells.
Foxp3CreTcf7fl/fl and control Foxp3Cre mice at 5 months of age were assayed for efficiency of CD4 T-cell polarization, using in vitro and in vivo assays. Representative FACS contour-plots (left) and cumulative histogram plots (right) are shown. (a) TH1 polarization in vitro, using total CD4+ splenocytes from the indicated mice. Magnetically purified CD4+ splenocytes containing both Tconv and Treg-cells from the indicated mice were stimulated in vitro under TH1 polarization conditions for 4 days and stained for CD4 and intracellular IFNγ (n = 5, p < 0.0004). (b) TH1 polarization in vitro, with equal numbers of CD4+ Treg-cells and CD4+ Tconv cells of the indicated mice. FACS purified CD62L+CD44−CD25−CD45.1+CD4+ cells from spleen were labelled with Cell Trace Violet, mixed 1:1 with YFP+CD45.2+CD4+CD25+ spleen Treg-cells, and stimulated under TH1 polarization conditions and assayed by FACS. IFNγ expression gated on CD45.1+ cells (n = 5, p < 0.002). (c) TH17 polarization in vitro, using total CD4+ splenocytes from the indicated mice. CD4+ splenocytes were purified and assayed as in “a”, and were stained for CD4 and intracellular IL-17A (n = 5, p < 0.0003; means ± SEM; two-sided, unpaired t-test). (d) TH17 polarization in vitro, with equal numbers of Treg-cells and CD4+ Tconv cells of the indicated mice. Cells were purified and mixed and analyzed by FACS as in “b”, for expression of intracellular IL-17A (n = 5, p < 0.001). (e) Quantitation of in vivo TH1 response to infection with TMEV. The indicated mice were assessed by FACS on day 7 post infection for expression of IFNγ by MLN (n = 5, p < 0.04) and spleen (n = 11, p < 0.001) derived CD4+ T-cells. (f) The same for CD8+ T-cells (MLN: n = 4, p < 0.04; spleen: Foxp3Cre: n = 6 & Foxp3CreTcf7fl/fl: n = 4; p < 0.003). (g) Quantitation of in vivo TH17 response after IP injection of αCD3. The indicated mice were assessed by FACS after 3 consecutive injections with antibody (see Materials and Methods) for expression of IL-17A by small bowel residing CD4+ T-cells (Foxp3Cre: n = 3, p < 0.0001; Foxp3Cre αCD3: n = 5; p < 0.01; Foxp3CreTcf7fl/fl αCD3: n = 5). Data are representative of two or more independent experiments. In all experiments n represents biological replicates, independent animals; means ± SEM, two-sided, unpaired t-test)

