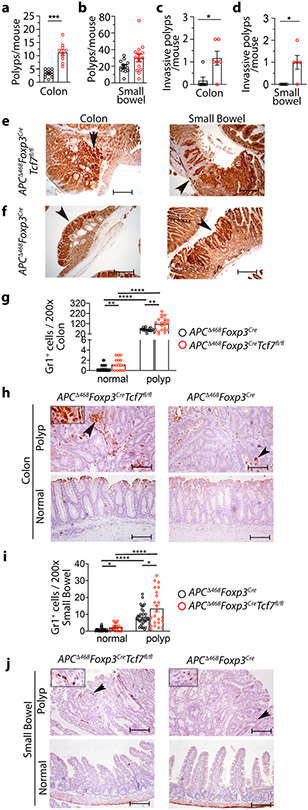
Figure 7. TCF-1-deficient Treg-cells promote inflammation and tumor growth in polyposis-prone APCΔ468 mice.
Tumor incidence, tumor aggression, and inflammation were quantified at 5.5 months of age in APCΔ468Foxp3CreTcf7fl/fl mice and compared to control APCΔ468Foxp3Cre mice. (a and b) Polyps and tumors in the excised colon (APCΔ468Foxp3Cre: n = 12 & APCΔ468Foxp3CreTcf7fl/fl: n = 10; p < 0.0001) and small bowel (APCΔ468Foxp3Cre: n = 12 & APCΔ468Foxp3CreTcf7fl/fl: n = 14; not significant) were visualized using a dissection microscope and manually counted. (c and d) Invasive lesions in the colon (n = 6; p < 0.01) and the small bowel (n = 5; p < 0.02). For the cumulative data (a, b, c & d), each symbol represents a value from an individual mouse. Tumor aggression was evaluated by counting lesions that had extensive nuclear β-catenin staining at the submucosal boundary, as determined by IHC. Benign polyps were identified by restricted β-catenin staining at the luminal boundary of the lesions. Each symbol represents a value from an individual mouse. (e and f) Representative IHC of colon and small bowel for nuclear β-catenin; scale bar 200 μm. (g and h) Quantification of Gr1 stained cells in the colon and representative IHC stained sections; scale bar 100 μm. (i and j) Quantification of Gr1 stained cells in the small bowel and representative IHC stained sections. Arrows in “h” and “j” point to Gr1 expressing cells. Each symbol represents counts in one field of vision (FOV) at 200x (g: normal: n = 4, p < 0.009, p < 0.0001, and polyp: n = 4, p < 0.001 & i: normal: n = 4, p < 0.01, p < 0.0001, and polyp: n = 4, p < 0.02). In all experiments n represents biologically independent animals; means ± SEM; two-sided, unpaired t-test.

