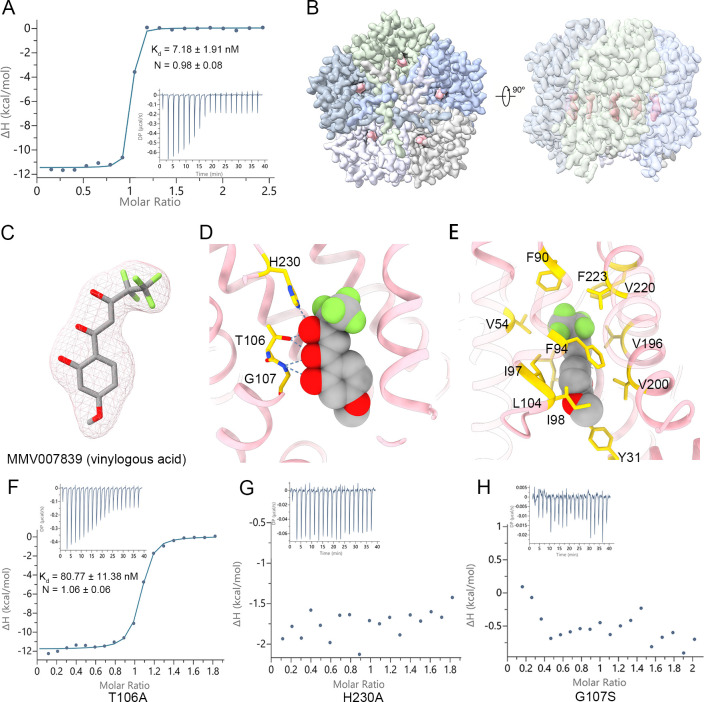
Fig 2. Inhibition of PfFNT by MMV007839.
(A) Binding affinity between PfFNT and MMV007839. (B) Density map of PfFNT in complex with MMV007839. The extra density for MMV007839 is highlighted in pink. The 5 protomers of PfFNT are distinguished by different colors. (C) The ligand density fits with the vinylogous acid form of MMV007839. The density for MMV007839, shown as the pink mesh, is contoured at 7.5 σ. (D) Coordination between PfFNT and MMV007839. MMV007839 is represented by sphere model. The polar contact between PfFNT and MMV007839 is shown. Inhibitor binding residues are shown as sticks and colored yellow. (E) The hydrophobic interactions between PfFNT and MMV007839. The hydrophobic residues in the cavity are shown as sticks and colored yellow. (F) Binding affinity between PfFNT T106A and MMV007839. (G) Binding affinity between PfFNT H230A and MMV007839. (H) Binding affinity between PfFNT G107S and MMV007839. The binding assay was performed via ITC and repeated 3 times. A representative titration is presented. The binding affinity (Kd) and N are presented as the value of mean ± SD (S2 Table). The raw data can be found in S1 Data. ITC, isothermal titration calorimetry; PfFNT, P. falciparum formate–nitrite transporter.

