
FIGURE 2.
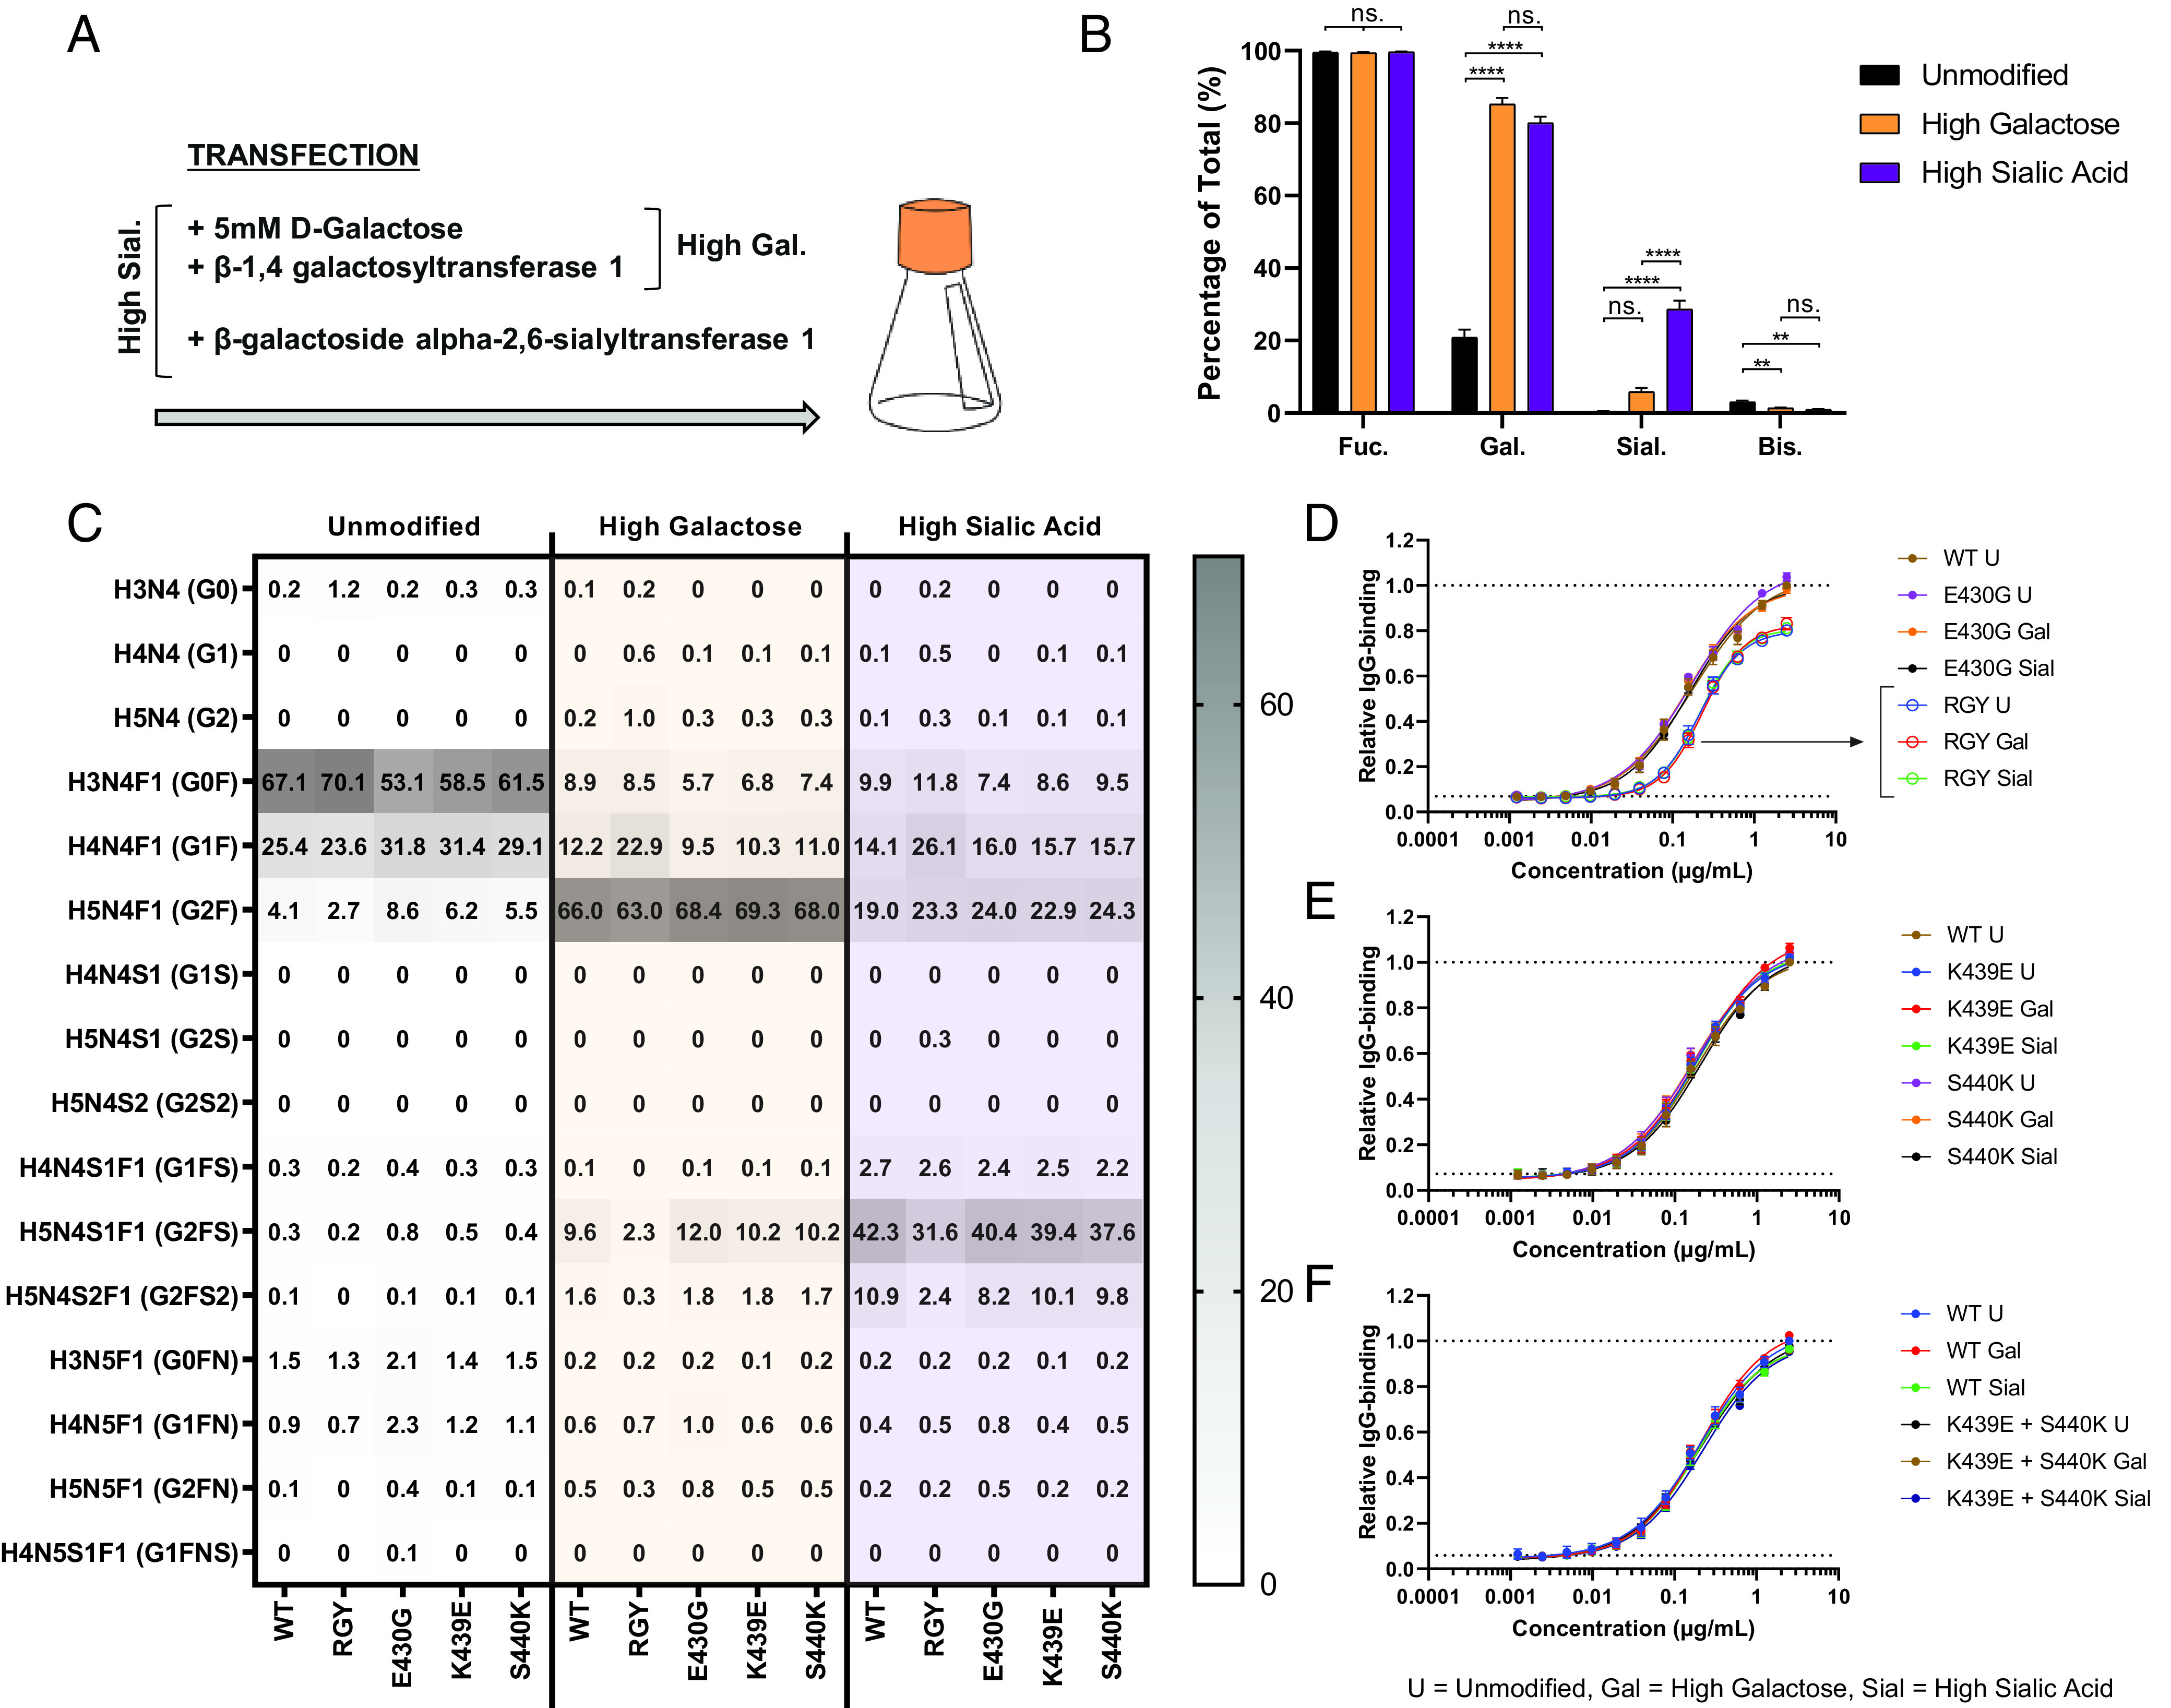
IgG glycoengineering for altered galactosylation and sialylation. (A) Schematic setup for the production process in HEK FreeStyle cells, with the addition of relevant substrates and constructs coding for enzymes prior/during transfection. (B and C) Fc glycosylation profiles of produced anti-biotin mAbs using different glycoengineering techniques to increase Fc galactosylation and sialylation, analyzed by mass spectrometry. The bar graphs represent the mean and SEM of five different mAbs. For the statistical analysis, an ordinary one-way ANOVA with Tukey multicomparison test was performed. (D–F) Relative levels of IgG binding of produced anti-biotin mAbs to 5× biotin/BSA are presented as relative value to the maximum response of the unmodified WT mAb, determined by ELISA (n = 3). Curve fitting was performed using nonlinear regression dose-response curves with log(agonist) versus response–variable slope (four parameters) in GraphPad Prism 8.0.2. No differences in opsonization were observed between glycovariants. **p ≤ 0.01, ****p ≤ 0.0001.