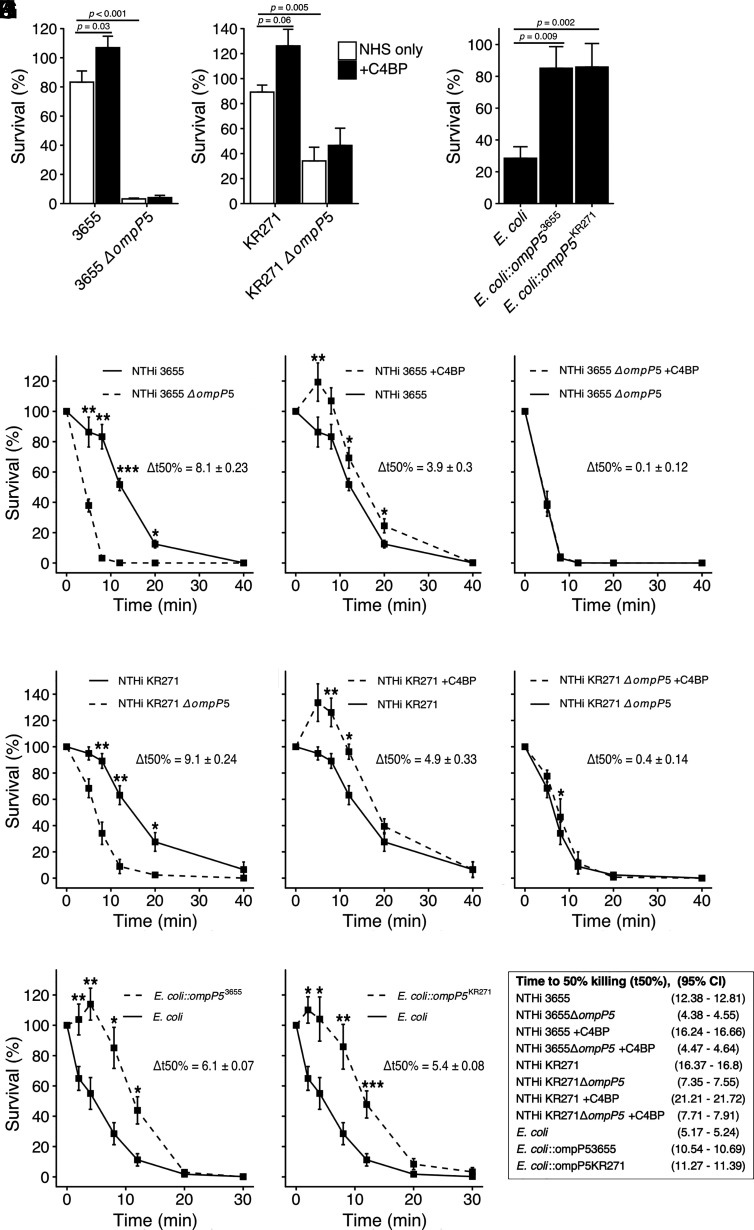
FIGURE 6.
NTHi P5 is important for serum resistance. NTHi strains 3655, NTHi KR271, and corresponding P5 mutant strains NTHi 3655ΔompP5 and KR271ΔompP5 were incubated with strain-optimized concentrations of NHS (3655, 2% and KR271, 7.5%) at 37°C, and percentage survival was assessed at different time points. (A and B) Serum resistance of strains NTHi 3655 and NTHi 3655ΔompP5, NTHi KR271, and NTHi KR271ΔompP5 after 8 min of incubation in NHS with or without preincubation with 10 µg/ml recombinant C4BP. (C) Serum resistance of naive E. coli BL21(DE3), E. coli::ompP53655, and E. coli::ompP5KR271 after 8 min of incubation in NHS. (D) Serum resistance of wild-type strain NTHi 3655 and NTHi 3655ΔompP5 at multiple time points. (E and F) Serum resistance after preincubation of NTHi 3655 (E) or NTHi 3655ΔompP5 (F) with 10 µg/ml recombinant C4BP. (G) Serum resistance of wild-type strain NTHi KR271 and NTHi KR271ΔompP5. (H and I) Serum resistance after preincubation of NTHi KR271 (H) or NTHi KR271ΔompP5 (I) with 10 µg/ml recombinant C4BP. (J and K) Serum resistance of naive E. coli BL21(DE3), E. coli::ompP53655 (J), and E. coli::ompP5KR271 (K) incubated with 0.5% NHS at 37°C and assessed at different time points. Each bar represents the mean ± SEM of three to eight independent experiments with technical duplicates. Statistical significance was calculated using (A and B) two-way ANOVA. (A) F(1, 29) = 3.77, p = 0.0621, η2 = 0.01; strain effect: F(1, 29) = 243.8, p < 0.001, η2 = 0.82. (B) F(1, 26) = 1.28, p = 0.2686, η2 = 0.01; strain effect: F(1, 26) = 38.37, p < 0.001, η2 = 0.55. Significant main effects were followed by Tukey multiple comparisons test, (C) one-way-ANOVA, F(2, 24) = 9.22, p = 0.001, η2 = 0.43 with Bonferroni post hoc test, (D–K) repeated measures two-way ANOVA, (D) F(5, 20) = 50.71, p < 0.001, η2 = 0.64; strain effect: F(1, 5) = 57.23, p = 0.002, η2 = 0.67. (E) F(5, 20) = 10.80, p < 0.001, η2 = 0.14; C4BP effect: F(1, 5) = 24.28, p = 0.008, η2 = 0.20. (F) F(5, 20) = 0.05, p = 0.99, η2 = 0.002; C4BP effect: F(1, 5) = 0.07, p = 0.80, η2 < 0.001. (G) F(5, 25) = 5.79, p = 0.006, η2 = 0.25; strain effect: F(1, 5) = 31.60, p = 0.002, η2 = 0.40. (H) F(5, 25) = 8.77, p < 0.035, η2 = 0.12; C4BP effect: F(1, 5) = 7.25, p = 0.031, η2 = 0.17. (I) F(5, 25) = 2.49, p = 0.15, η2 = 0.03; C4BP effect: F(1, 5) = 5.46, p = 0.67, η2 = 0.02). (J) F(6, 24) = 18.09, p < 0.001, η2 = 0.39; C4BP effect: F(1, 8) = 5.46, p = 0.005, η2 = 0.41). (K) F(6, 24) = 14.70, p = 0.008, η2 = 0.22; C4BP effect: F(1, 8) = 20.60, p = 0.002, η2 = 0.30. t50% was calculated from linear regression analysis of time (min) and proportion of dead bacteria. This was followed by analysis of simple main effect for strain or C4BP preincubation; statistical significance received Bonferroni adjustment, *p < 0.05, **p < 0.01, and ***p < 0.001 as indicated.

