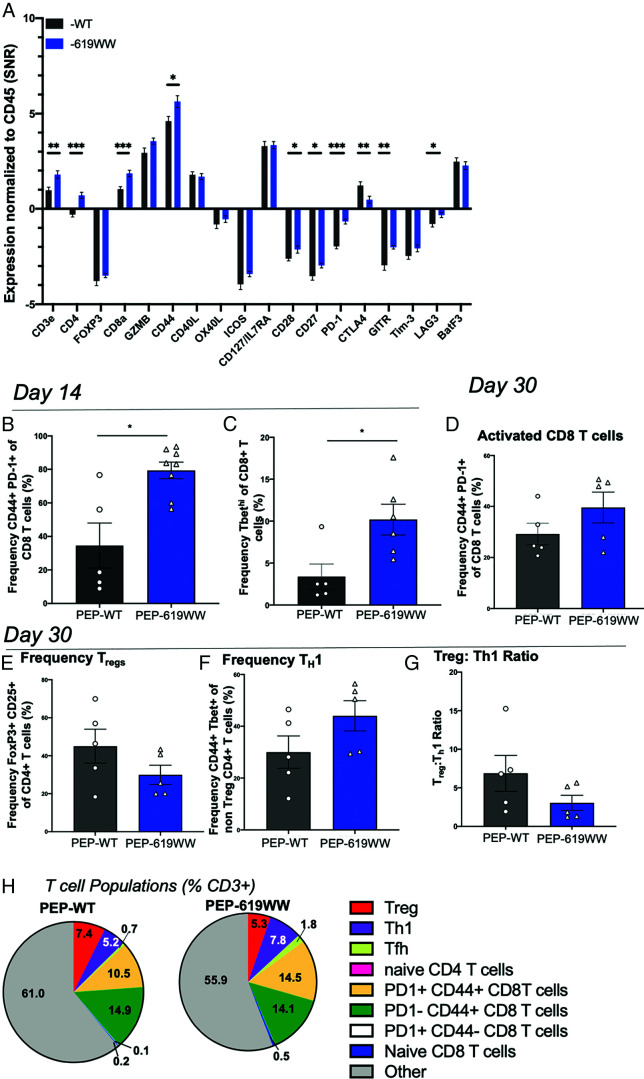
FIGURE 3.
Enhanced T cell activation in tumors from PEP-619WW mice. (A) Relative abundance of indicated proteins (normalized to CD45+) within CD45+-rich regions of 14 d postimplant B16-OVA tumors; data are from NanoString GeoMX DSP platform. Flow cytometry analysis of whole tumor at 14 d postimplant. (B) Frequency CD44+ PD1+ Cd8 T cells (lymphocyte > single cell × 2 > live > CD45+ > CD3+ CD19− > CD8a+ CD4− >CD44+ PD-1+) and (C) Tbethi CD8 T cell (lymphocyte > single cell × 2 > live > CD45+ > CD3+ CD19− > CD8a+ CD4− > Tbethi). (D) Frequency of activated CD8 T cells at 30 d (same gating strategy as in B). Frequency of (E) Tregs (lymphocyte > single cell × 2 > live > CD45+ > CD3+ CD19− > CD8a− CD4+ > Foxp3+ CD25+), (F) Th1 cells (lymphocyte > single cell × 2 > live > CD45+ > CD3+ CD19− > CD8a− CD4+ > Foxp3− > CD44+ Tbet+), (G) ratio of Treg to Th1 (%Treg/%Th1), and (H) breakdown of multiple T cell phenotypes 30 d postimplant. T follicular helper (Tfh) cells identified as non-Tregs > CXCR5+ PD-1+. t-test with Welch’s correction, *p < 0.05, **p < 0.01, ***p < 0.001. Data shown are from a representative experiment. Experiments were repeated three times. SNR, single-to-noise ratio.

