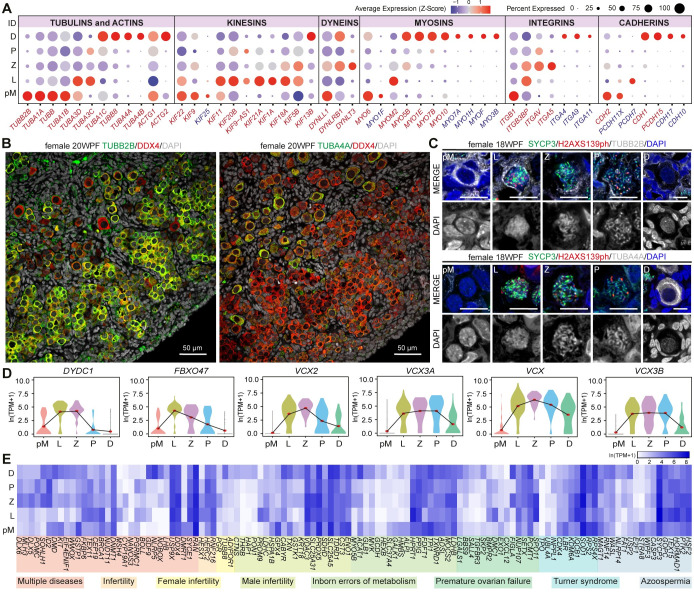
Fig 2. Expression of cytoskeletal and adhesion genes in female meiotic prophase I.
(A) Dot plot showing scaled average expression (Z-score) of the cytoskeleton, motor and cell adhesion gene families in different meiotic prophase I stages (pre-meiotic, pM; leptotene, L; zygotene, Z; pachytene, P and dictyate/diplotene, D). Gene names in red are fDEGs and in blue are not fDEGs. (B) Immunofluorescence of 20WPF ovary for TUBB2B (left) and TUBA4A (right) with DDX4. Scale bars are 50μm. (C) Immunofluorescence of 18WPF ovary for TUBB2B (top) and TUBA4A (bottom) with SYCP3 and H2AXS139ph in selected FGC in pM, L, Z, P and D. Scale bars are 10μm. (D) Violin plots showing expression dynamics of selected fDEGs. Red dots mark mean expression per cluster. (E) Heatmap showing expression of fDEGs associated with reproductive-related disorders.

