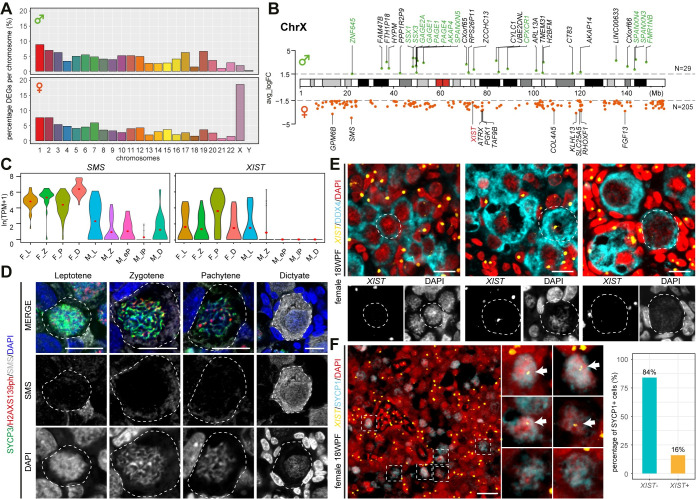
Fig 5. Differences in X-linked expression between the sexes.
(A) Bar plot showing the percentage of meiotic male-DEGs (top) and female-DEGs (bottom) per chromosome. (B) Loci map of the X-linked meiotic male-DEGs (top) and female-DEGs (bottom) on the ChrX. Genes in green belong to the family of cancer/testis antigens, XIST is in red. (C) Violin plots showing expression of SMS and XIST. Red dots mark mean expression per cluster (pre-meiotic, pM; leptotene, L; zygotene, Z; pachytene, P and dictyate/diplotene, D). (D) Immunofluorescence for SMS, SYCP3 and H2AXS139ph in leptotene, zygotene, pachytene and dictyate FGC in 14-18WPF ovarian sections. Scale bars are 10μm. (E) RNA FISH for XIST combined with immunofluorescence for DDX4 in 18WFP ovaries. White dashed lines indicate selected DDX4+ FGC shown with separate channels for XIST and DAPI (bottom). Scale bars are 10μm. (F) RNA FISH for XIST combined with immunofluorescence for SYCP1 in 18WFP ovaries (left) and quantification of SYCP1+ FGC regarding XIST expression (right). White dashed boxes indicate selected SYCP1+ FGC, magnified in the middle panels. White arrows indicate XIST. Scale bars are 20μm.

