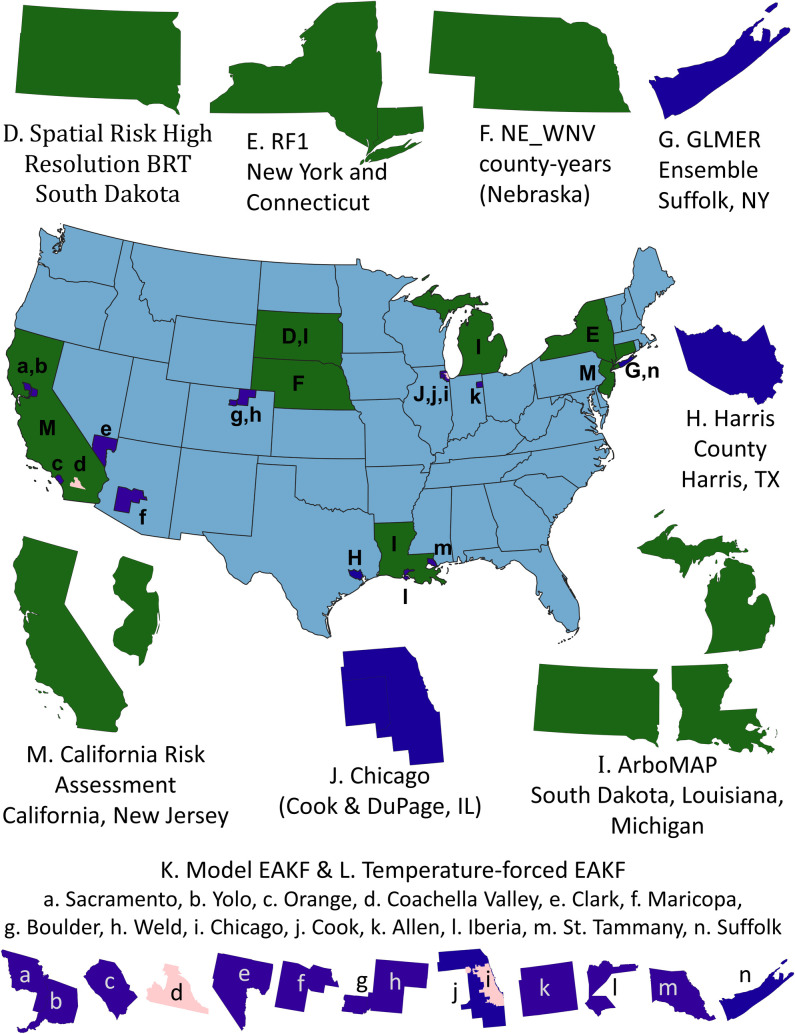
Fig 1. Map of specific locations where WNV models included in this comparison have been applied.
Some models (Spatial Risk Random Forest, not shown) have been applied across the entire US. Green corresponds to analyses with state extents, blue to county extents, and pink to subcounty extents. State outlines are from Natural Earth (https://www.naturalearthdata.com/downloads/50m-cultural-vectors/). City of Chicago boundary is publicly available from the City of Chicago (https://data.cityofchicago.org/Facilities-Geographic-Boundaries/Boundaries-City/ewy2-6yfk), and county boundaries and the outline for Coachella Valley were derived from US Census tract boundaries (https://www.census.gov/geographies/mapping-files/time-series/geo/carto-boundary-file.html) dissolved to provide a single outline using the Dissolve algorithm in QGIS (https://qgis.org/en/site/). WNV, West Nile virus.

