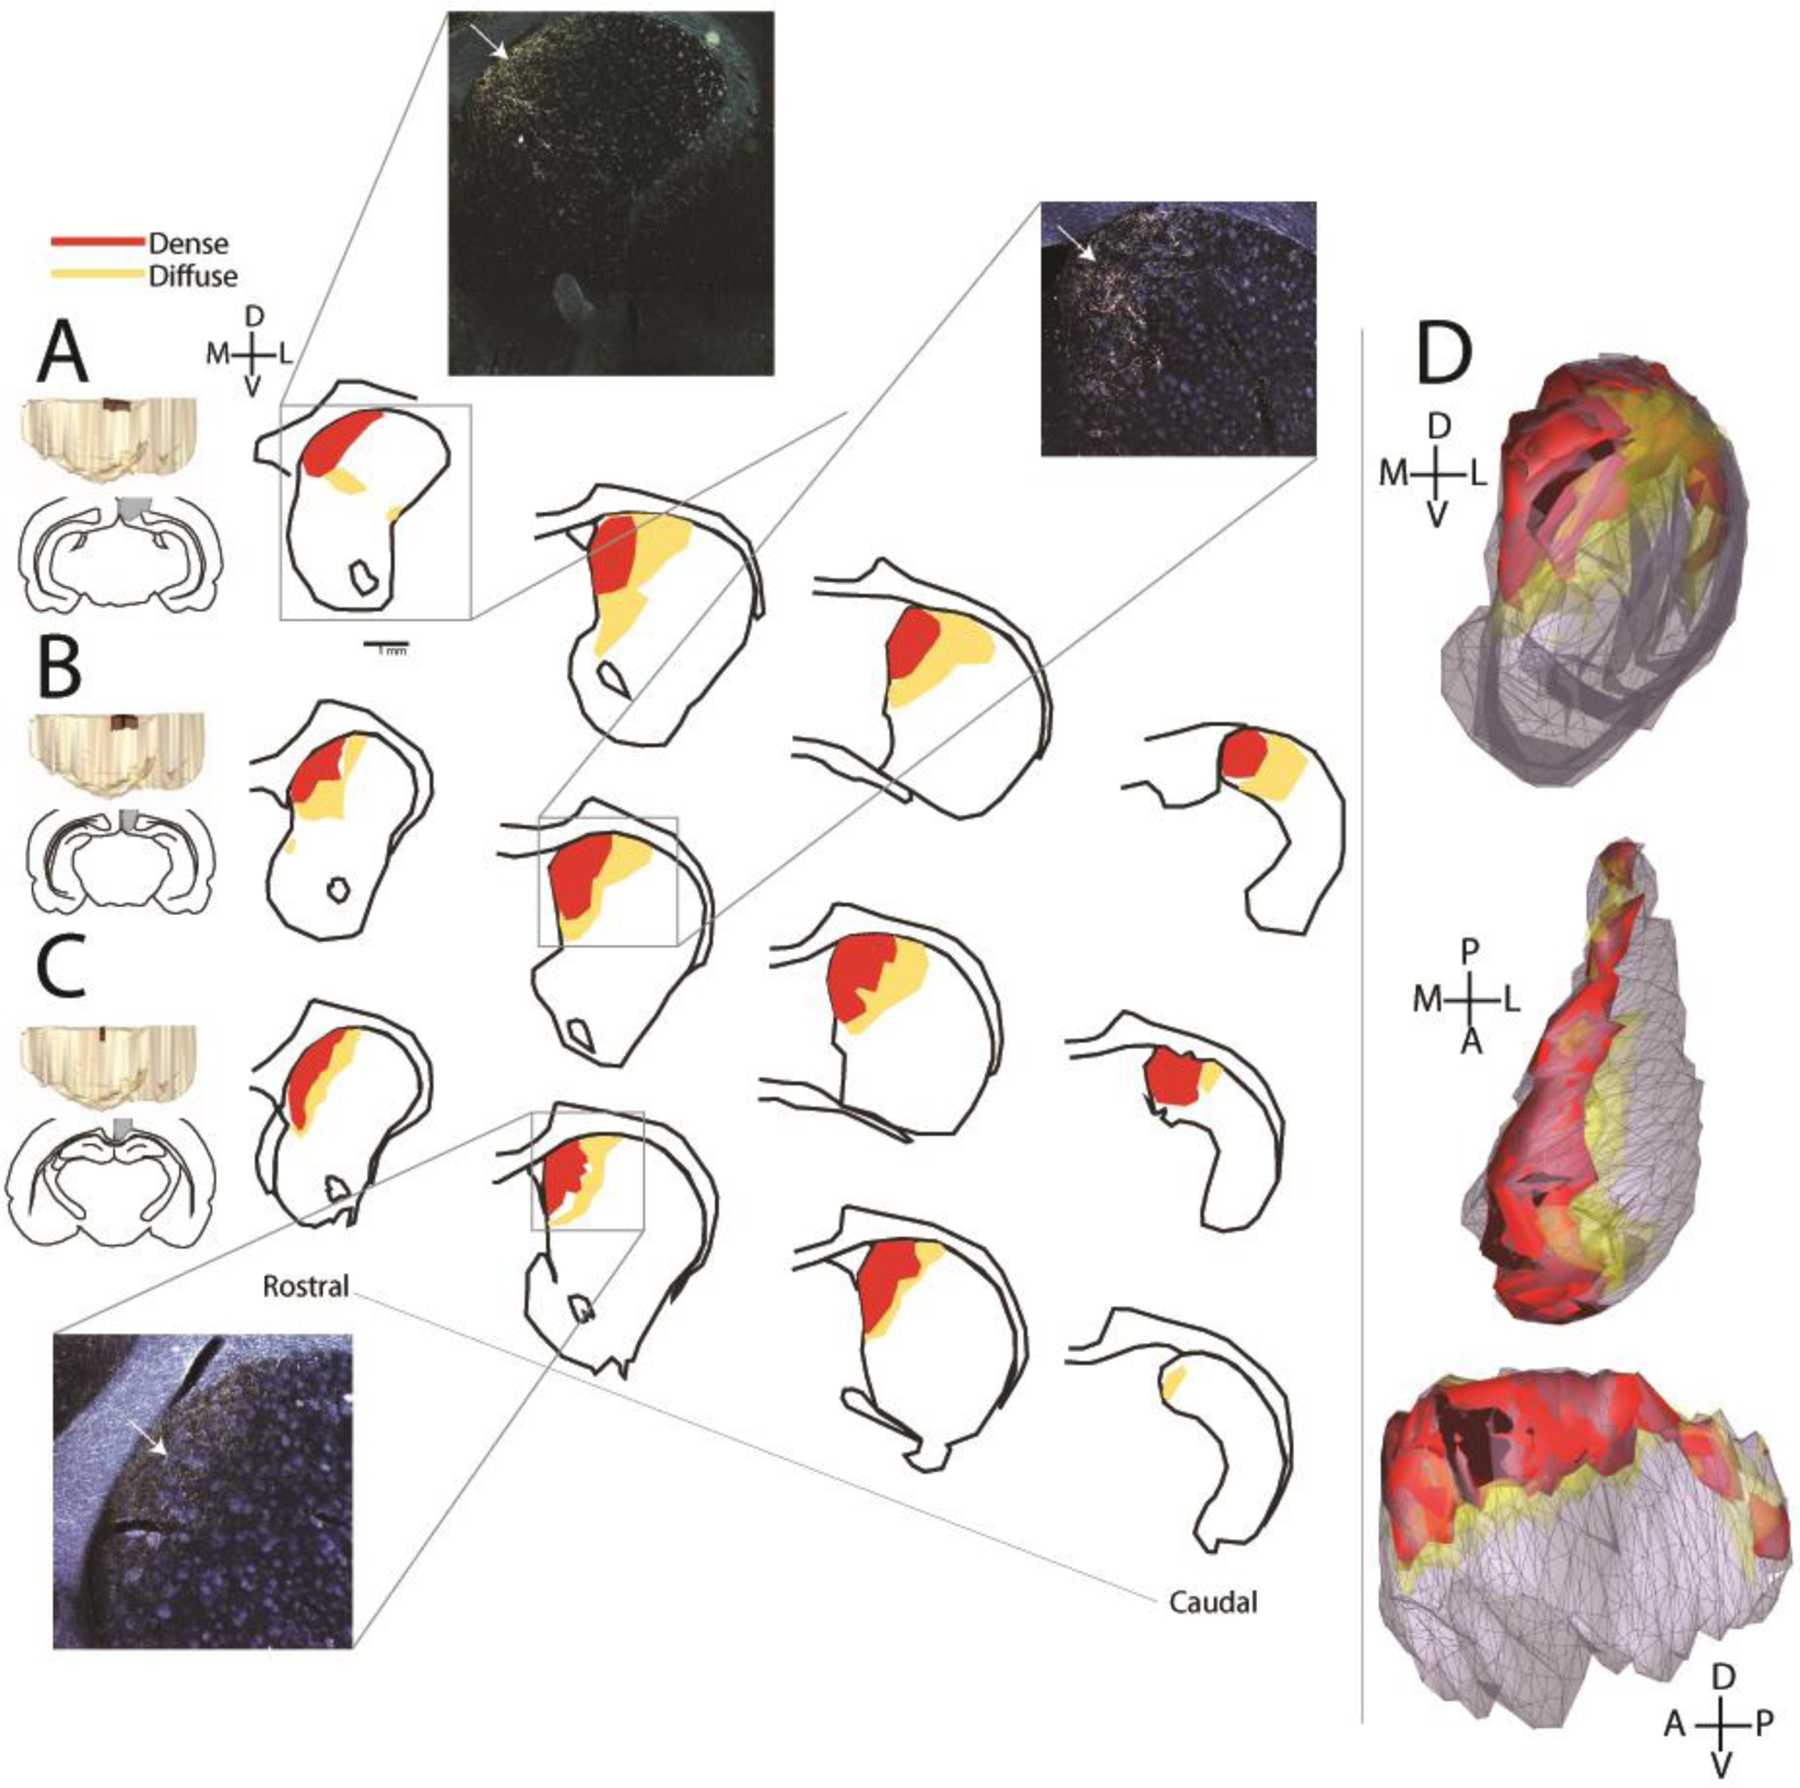
Figure 1. RSC-striatal terminal fields.

Images at far left show 3D models and outlines for the three injection sites (A-C). The coordinates of the spread of the injection sites in the anterior/ posterior direction are A. −4.8 to −8.6 AP B. −4.8 to −8.8 AP and C. −5.0 to −6.0 AP. Drawings show coronal striatal sections with terminal fields from rostral to caudal striatum. Photomicrographs show coronal darkfield images of ipsilateral striatal terminal fields. White arrows point to dense terminal fields. D. Collective model of the striatal projection zone of the RSC from coronal (top), horizontal (middle), and sagittal (bottom) views, all cases combined. Scale bar=1mm.
