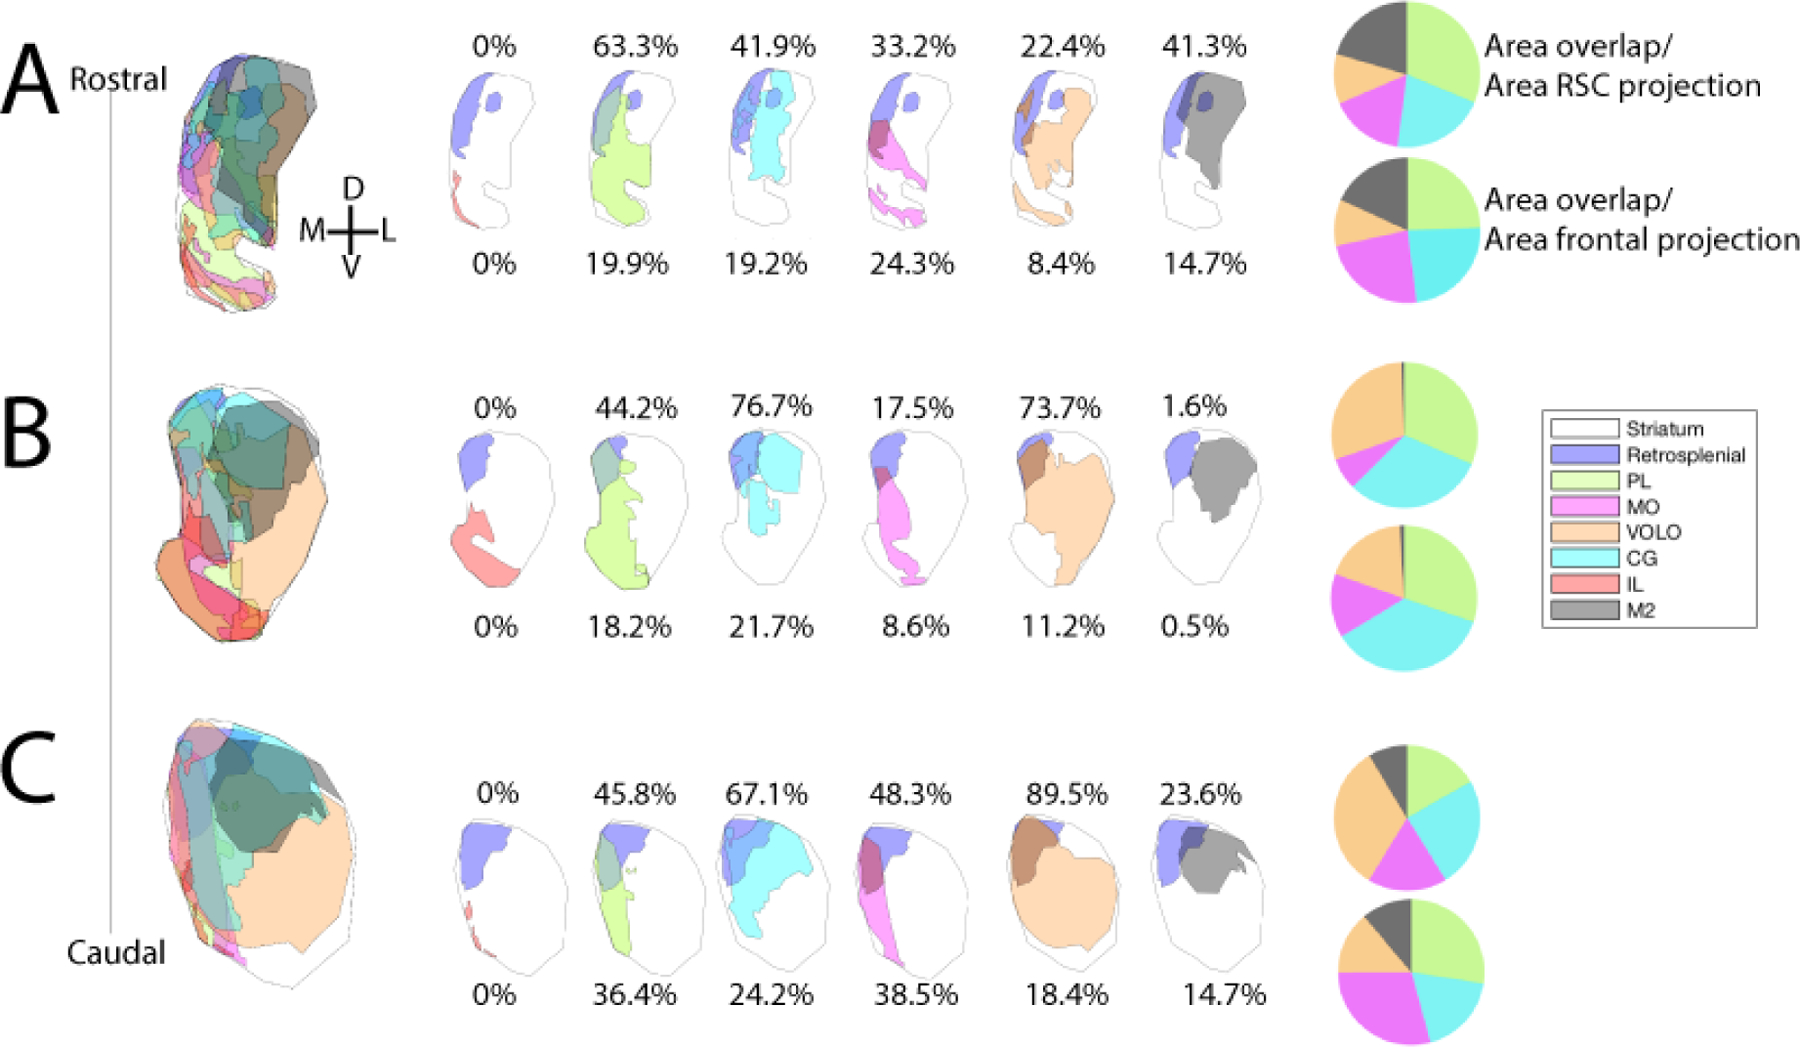
Figure 3. Cortico-striatal overlap.

Analyses of overlap of the RSC projection zone in the striatum with select frontal area projection zones. Drawings depict the RSC projection zone (purple) at AP +2.3 (A), AP +1.1 (B), and AP −0.1 (C) compared to IL (red), PL (yellow-green), CG (light blue), MO (purple), VOLO (orange), and M2 (black) projection zones. Numbers and pie charts show the area of the RSC-striatal projection zone encapsulated within the frontal area’s projection zone, divided by the area of the RSC projection (top) or the area of the frontal projection (bottom). AP=anterior-posterior distance from bregma; IL=infralimbic cortex; PL=prelimbic cortex; CG=anterior cingulate cortex; MO=medial orbital cortex; VOLO=ventral and lateral orbital cortex.
