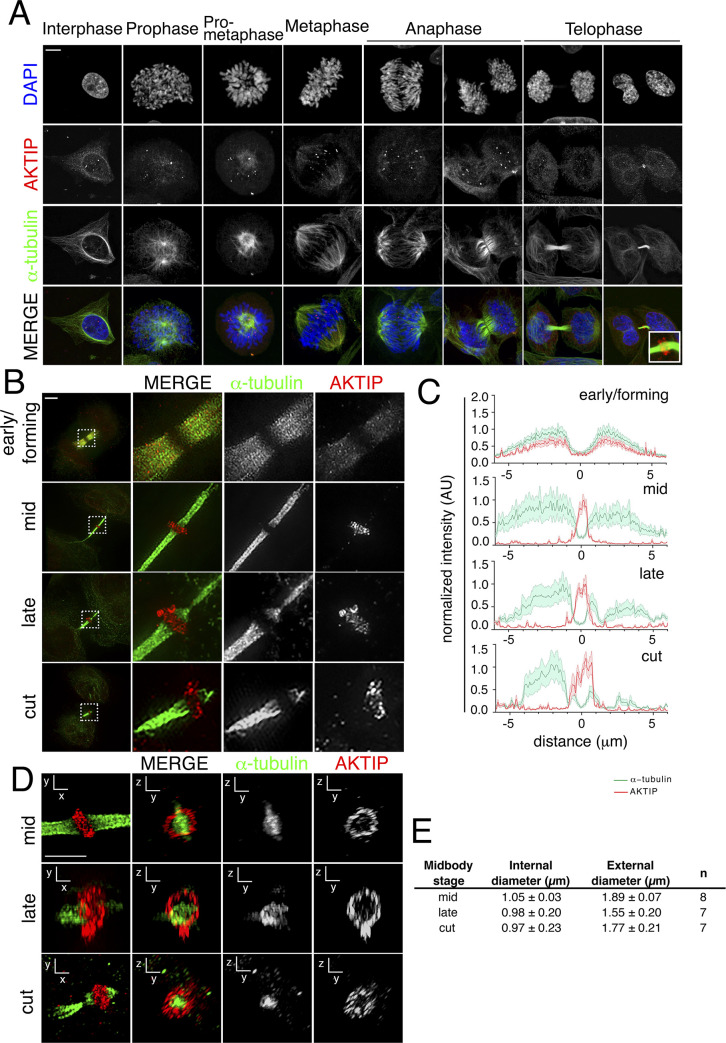
Fig 1. AKTIP localizes as a ring at the dark zone of the midbody.
(A) Confocal immunofluorescence images showing the distribution of AKTIP during mitosis and cytokinesis. HeLa cells were stained with anti-AKTIP (red), anti-α-tubulin (green) and DAPI to visualize DNA (blue). Scale bar, 5μm. (B) Representative 3D-SIM images of cells observed for AKTIP at the midbody in early, mid, late and cut stages. HeLa cells were stained with α-tubulin (green) and AKTIP (red) antibodies. Scale bar, 5μm. (C) Representative fluorescence intensity profile plotted for AKTIP and α-tubulin along the midbody at different stages; early/forming (n = 6), mid (n = 7), late (n = 8), cut (n = 8). (D-E) Representative 3D-SIM images of AKTIP ring (D) and relative measurements (E). Size of AKTIP structure measured in mid (n = 8), late (n = 7) and cut (n = 7) midbodies. Scale bar, 2.5μm.

