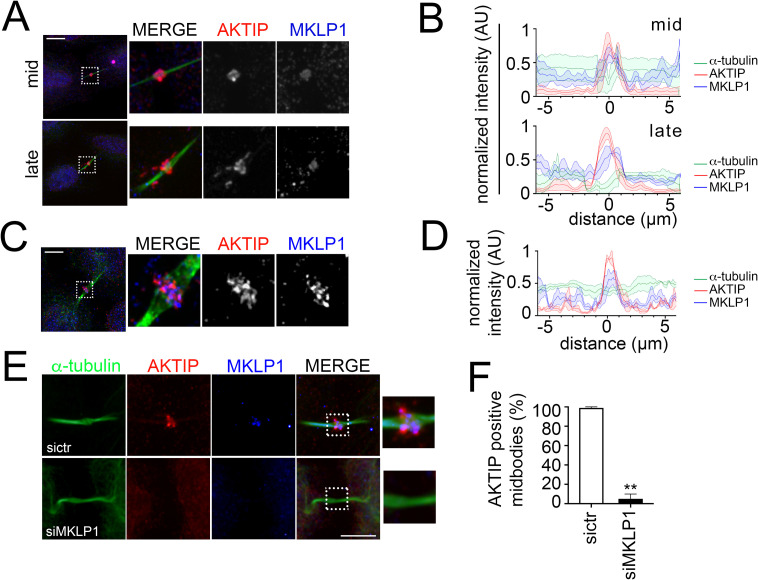
Fig 7. AKTIP recruitment to the midbody is MKLP1 dependent.
(A) Spinning disk microscopy images of MKLP1 (blue), AKTIP (red) and α-tubulin (green). (B) Representative fluorescence intensity profile plotted for AKTIP, MKLP1 and α-tubulin along the midbodies at different stages; mid, n = 3; late, n = 3. (C) MSIM images of MKLP1 (blue), AKTIP (red) and α-tubulin (green). (D) Representative fluorescence intensity profile plotted for AKTIP, MKLP1 and α-tubulin along mid midbodies from (C); n = 3. (E) Representative images of sictr and siMKLP1 HeLa cells stained for AKTIP (red), MKLP1 (blue) and α-tubulin (green) showing that AKTIP recruitment is MKLP1 dependent. (F) Quantification of AKTIP positive midbodies in sictr and siMKLP1 cells. For results in (F) at least 25 midbodies were counted for each sample. Scale bars, 5μm.

