
Fig. 2 |. Prevalence of DS and pregnancy outcomes in the USA.
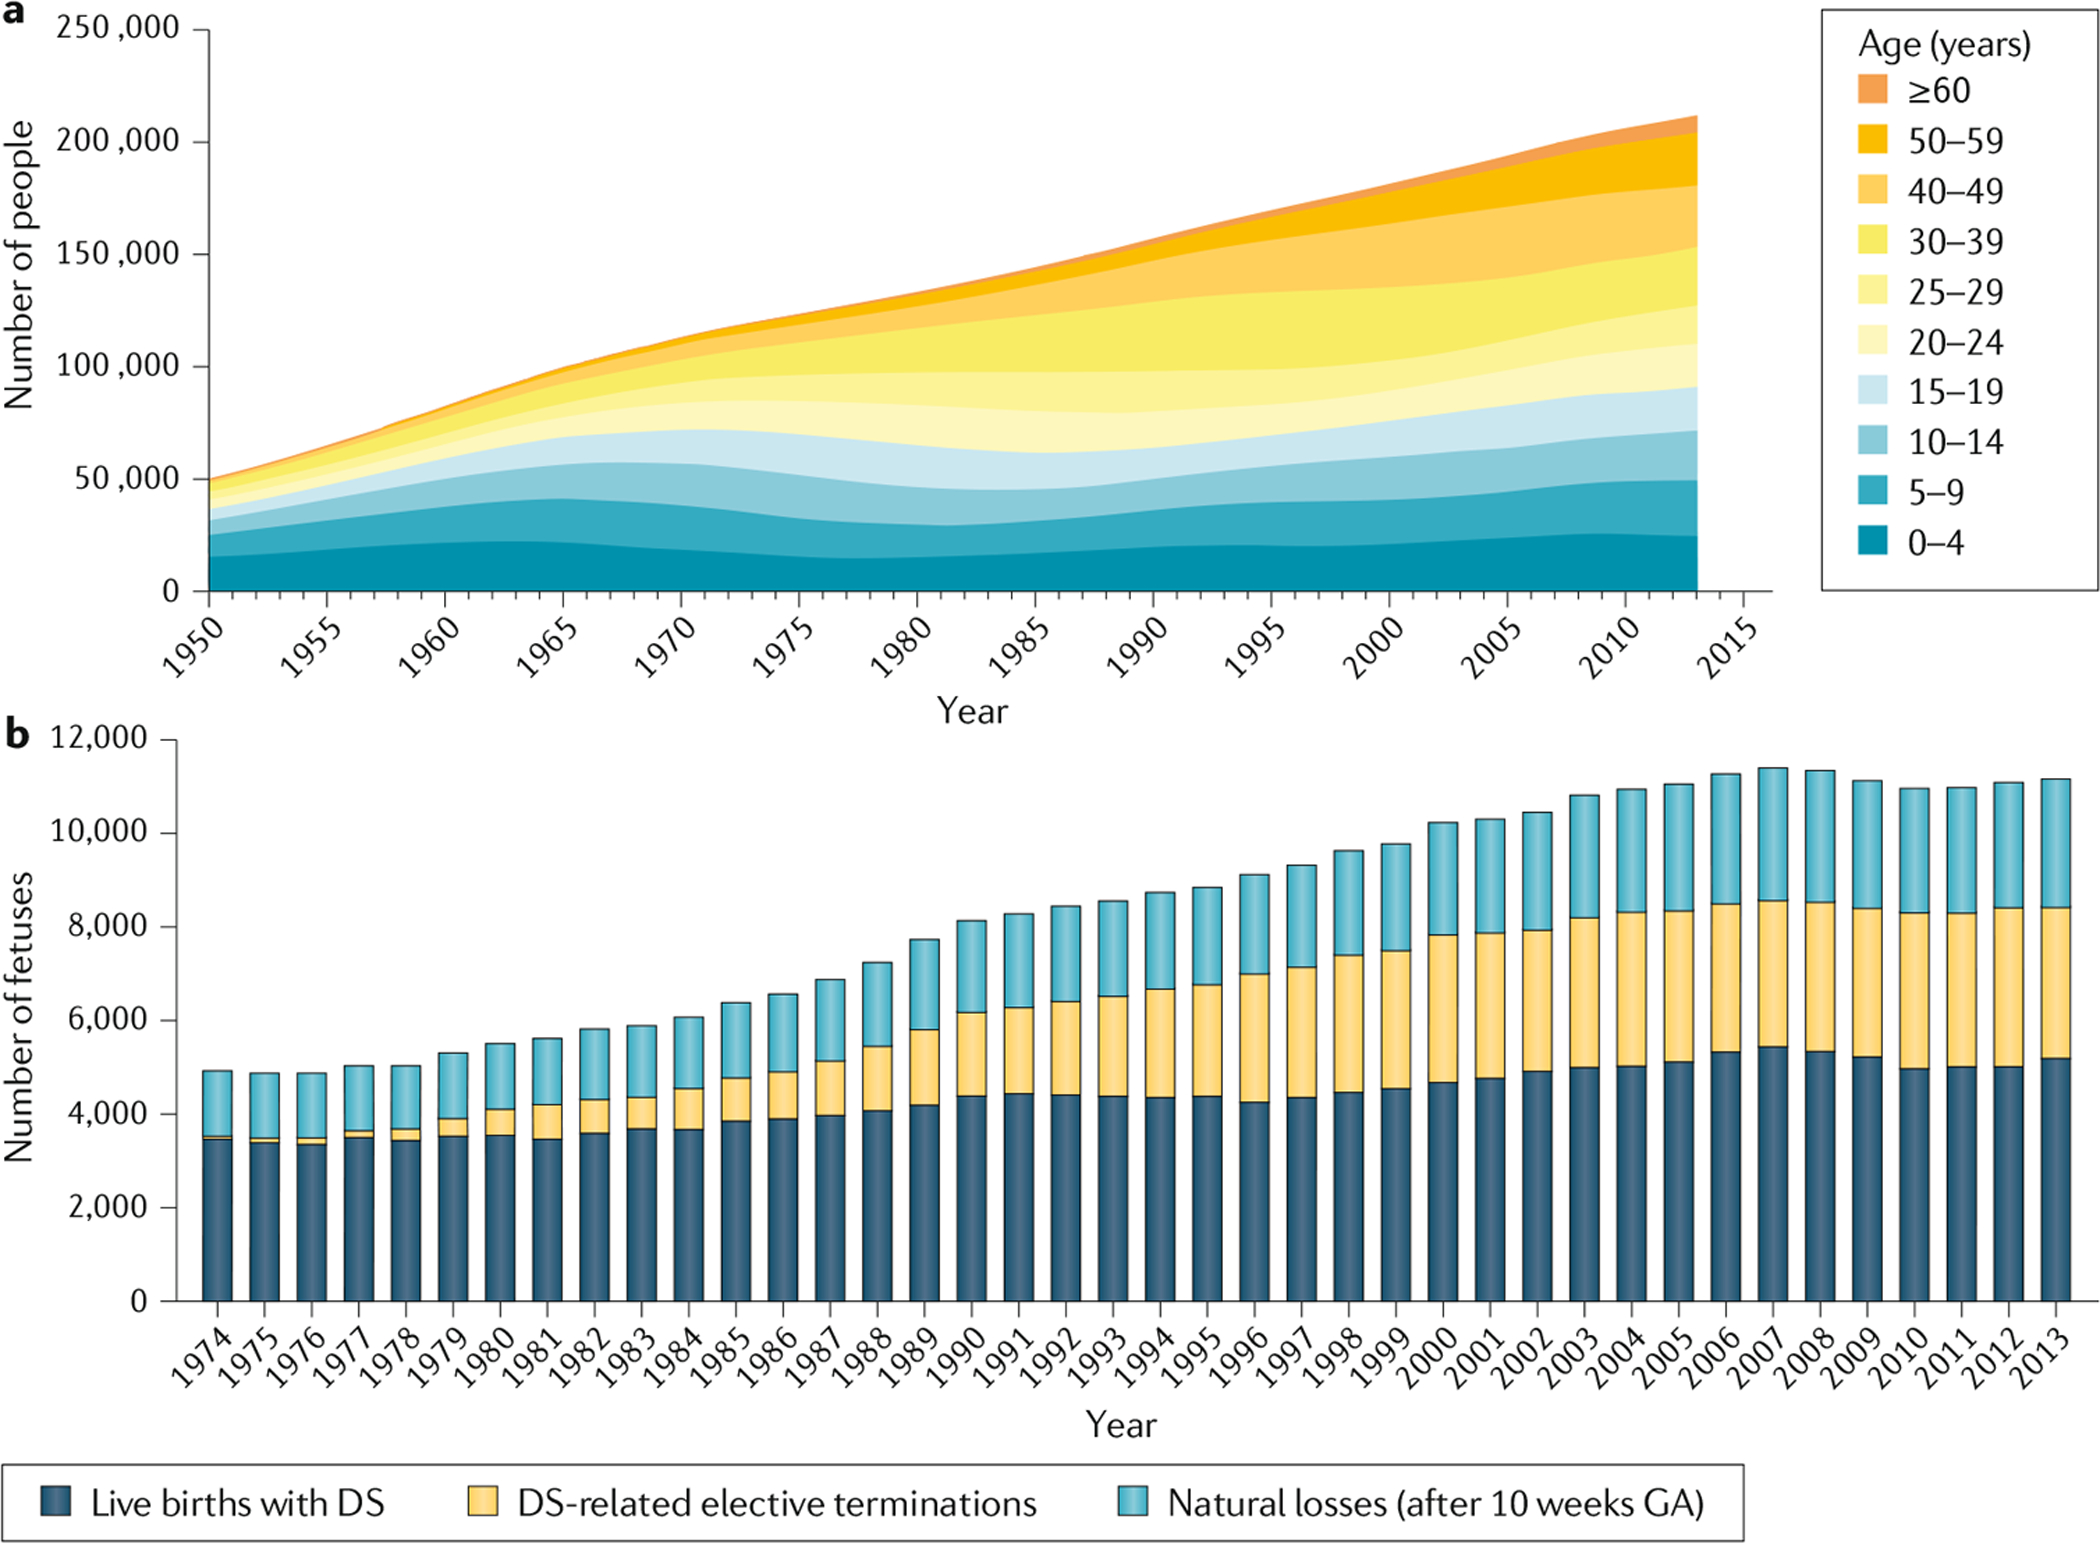
a | Prevalence of Down syndrome (DS) in the USA for the period 1950–2013. This graph combines the prevalence data for 1950–2010 in the USA9 with unpublished prevalence data for 2011–2013 for the same region10. b | Pregnancy outcomes in the USA for the period 1974–2013. This graph combines estimates of live births, natural losses and elective terminations in women carrying a fetus with DS after 10 weeks gestation for the period 1974–2010 in the USA17 with unpublished data for 2011–2013 (REF.10). GA, gestational age. Part a adapted from REF.11, Springer Nature Limited. Part b adapted with permission from REF.17, Wiley-VCH.