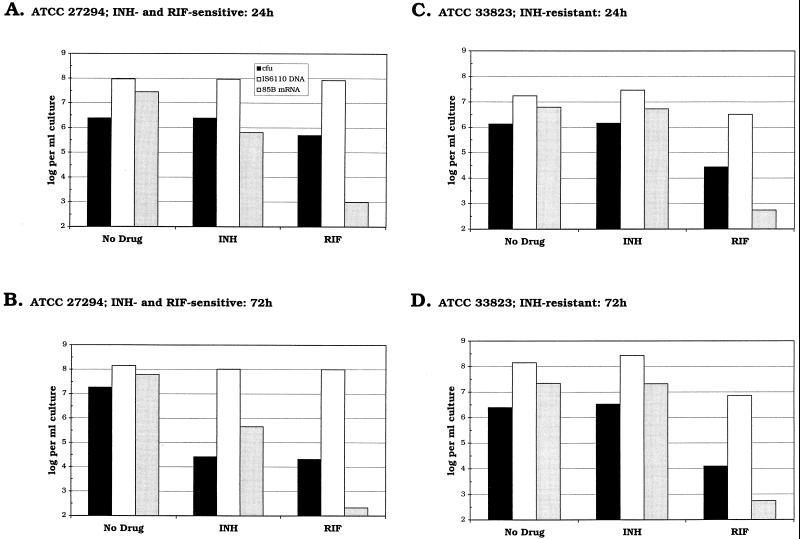
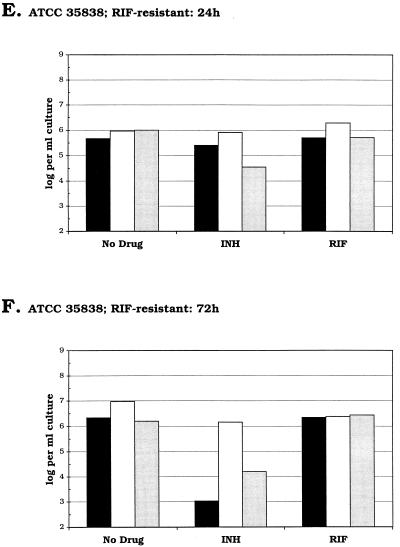
FIG. 1.
Charts showing log10 numbers of CFU (■), numbers of copies of IS6110 DNA (□), and numbers of copies of 85B mRNA ( ) per milliliter of culture for each of the three strains of M. tuberculosis after 24 h (A, C, and E) or 72 h (B, D, and F) of exposure to either no drug, 0.2 μg of INH per ml, or 1 μg of RIF per ml. The nucleic acid levels presented here are the mean values obtained from extraction of duplicate samples.


