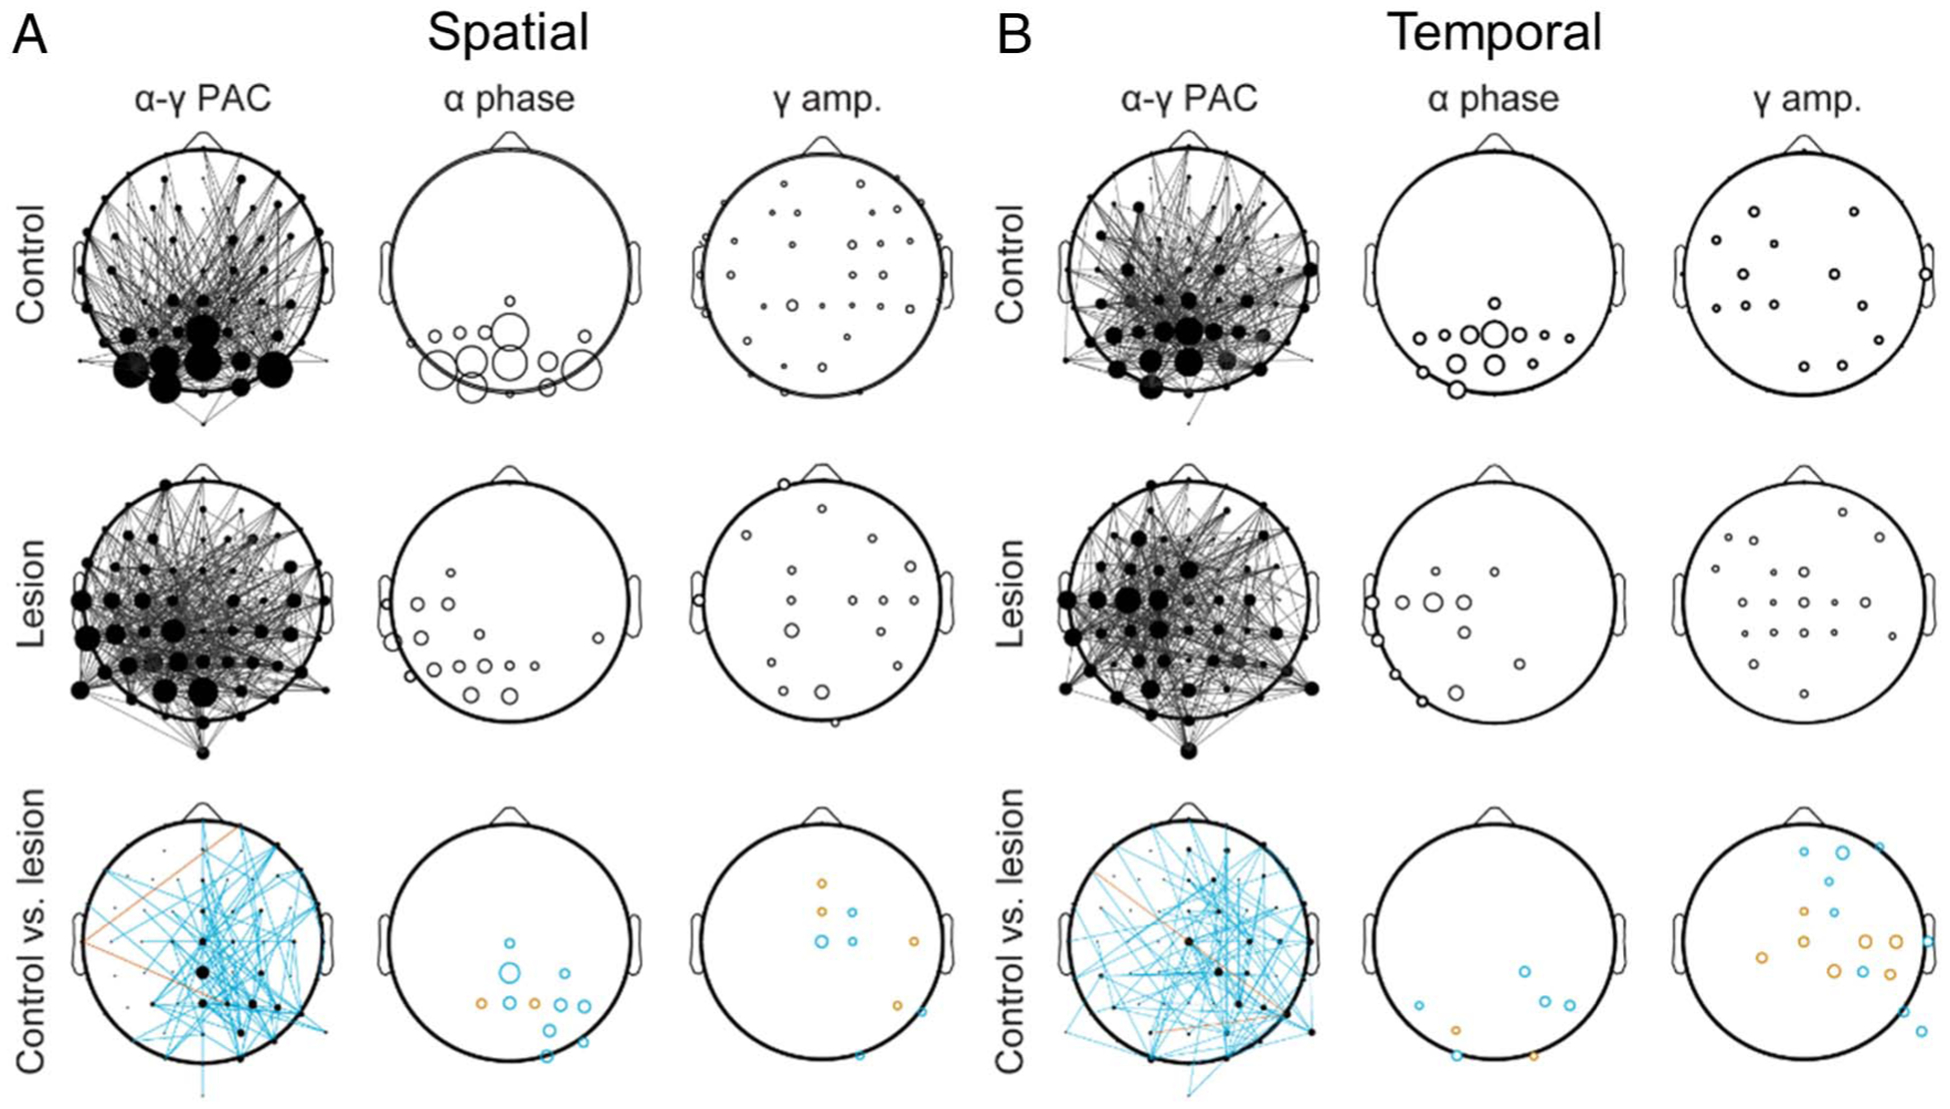
Figure 7.

pFC lesions disrupt posterior α coordination of feature selection. (A) Scalp distributions of the top 30% of α–γ connections during spatial feature selection (i.e., TOP vs. BOTTOM) in controls (top), lesion patients (middle), and controls versus lesion patients (bottom). Lines indicate channel pairs exhibiting PAC (left), and the size of each circle indicates the relative number of cross-frequency connections at each α phase (middle) and γ amplitude (right) channel. Note the parieto-occipital focus of α channels in controls but not lesion patients. Turquoise, significant control > lesion; red, control < lesion. (B) Same as (A) for temporal feature selection (i.e., FIRST vs. SECOND).
