. 2021 Aug 26;10:e67518. doi: 10.7554/eLife.67518

Figure 3. The structure of trimeric PSI from C. aponinum.

(A) C. aponinum trimeric PSI (B) chlorophyll B40 shifts its position due to the insertion seen in the PsaB subunit in C. aponinum (green) compared to Synechocystis (black). (C) The PsaL subunits of C. aponinum (green) and Synechocystis (black) showing the difference of the overall structure of the PsaL C-terminus. (D) The C-terminus of the PsaL subunit of C. aponinum (green) and Synechocystis (black) displaying the coordination to the Ca2+ in the adjacent monomer in Synechocystis, but is absent in C. aponinum and the Red_d mutant of Synechocystis. (E) C. aponinum and its electron density map compared to (F) Synechocystis (PDBID 5OY0, shown with 2Fo-Fc map) clearly depicting no density for the Ca2+ ion in the map for C. aponinum.

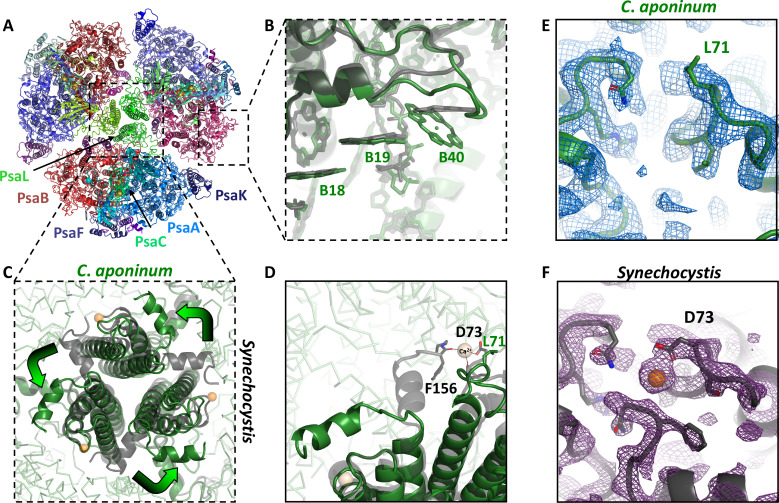
Figure 3—source data 1. Source data for Figure 3.

Figure 3.

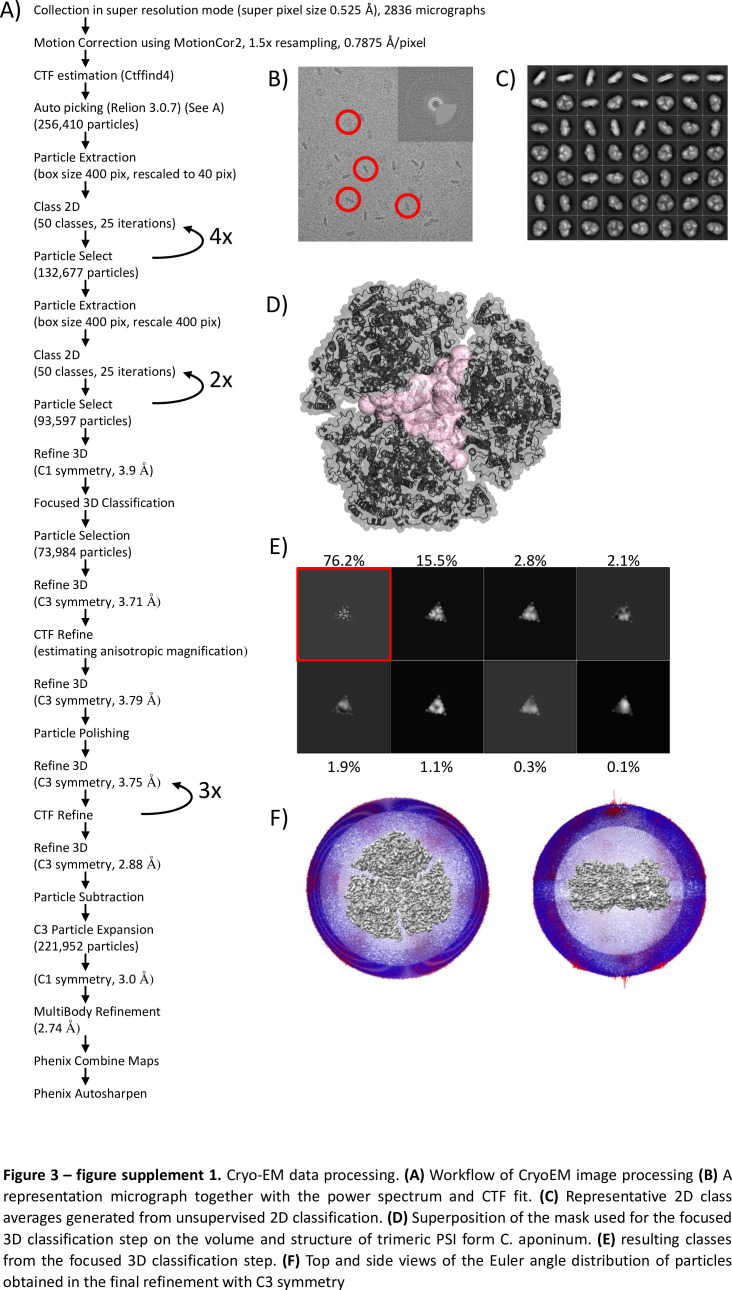
Figure 3—figure supplement 1. Cryo-EM data processing.

Figure 3—figure supplement 1.

(A) Workflow of CryoEM image processing. (B) A representation micrograph together with the power spectrum and CTF fit. (C) Representative 2D class averages generated from unsupervised 2D classification. (D) Superposition of the mask used for the focused 3D classification step on the volume and structure of trimeric PSI form C. aponinum, (E) resulting classes from the focused 3D classification step. (F) Top and side views of the Euler angle distribution of particles obtained in the final refinement with C3 symmetry.
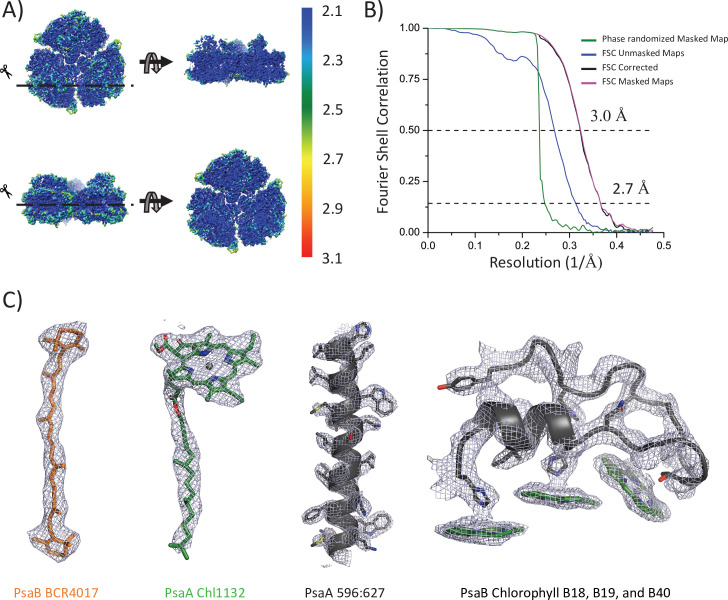
Figure 3—figure supplement 2. Model resolution and map examples.

Figure 3—figure supplement 2.

(A) The final 3D map colored according to the local resolution estimates obtained from ResMap,. (B) Plots of the fourier shell correlation (FSC) against resolution. (C) Representative map sections showing carotenoid, chlorophyll, transmembrane helices, and the PsaB loop insertion. The identity of each is indicated.
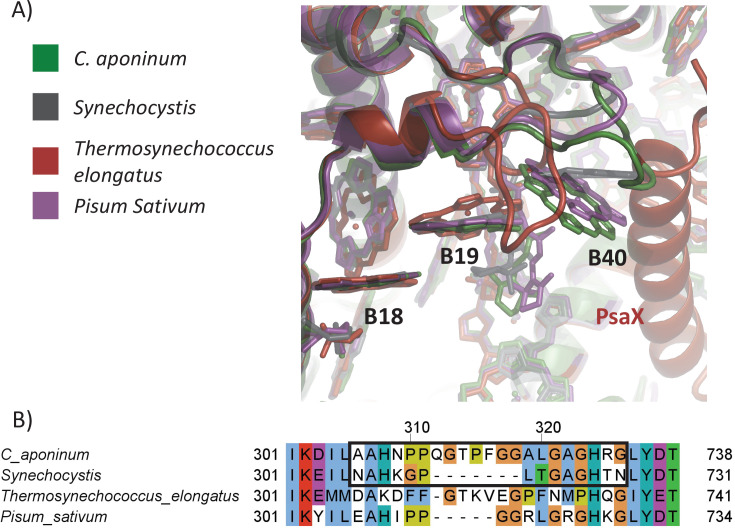
Figure 3—figure supplement 3. The local environment of Chl1240.

Figure 3—figure supplement 3.

(A) Structural comparison surrounding the CHL1240 coordination across PSI from different species. (B) Protein sequence of the loop region. The mutation made into Synechocystis is outlined in black.
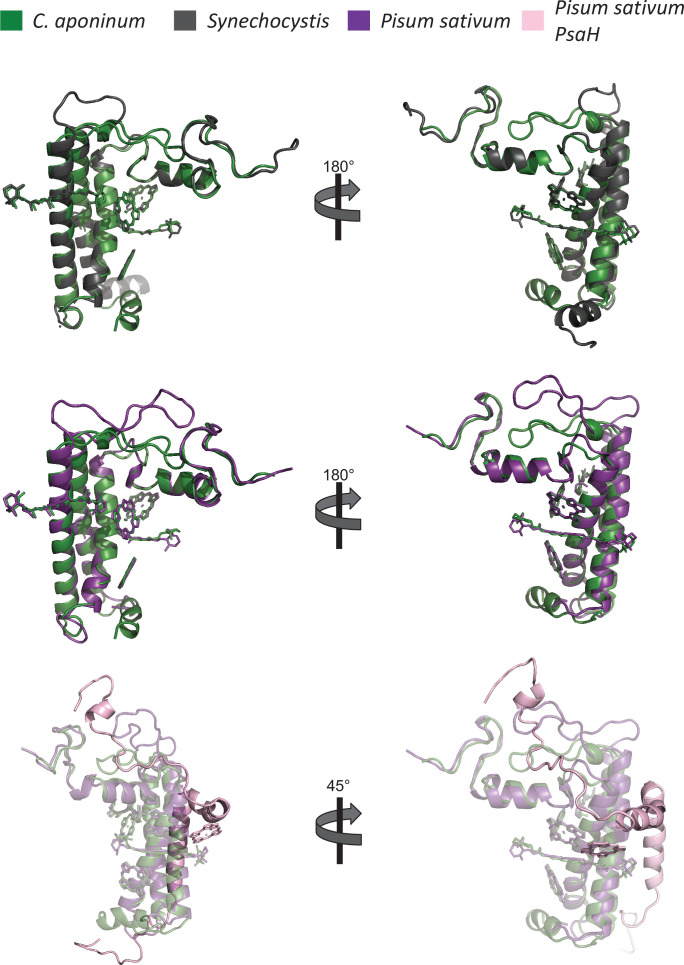
Figure 3—figure supplement 4. Comparison of the PsaL subunits from C.

Figure 3—figure supplement 4.

aponinum (green), Synechocystis (black), and Pisum Sativum (purple) including the PsaH subunit (pink) in Pisum sativum.
Figure 3—figure supplement 5. Ca2+ coordinating residue in prokaryotes.

Figure 3—figure supplement 5.

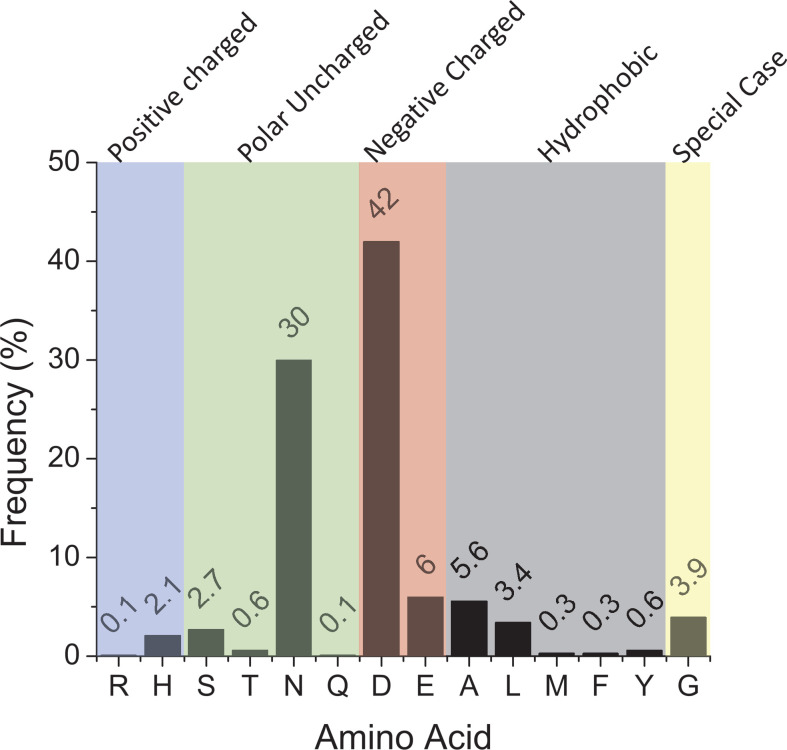
A bar graph representing the frequency of different amino acids in cyanobacteria at the position corresponding to PsaL-D73 in Synechocystis. Negatively charged residues such as aspartate (D) or glutamate (E) probably correspond to Ca2+ coordination. The final alignment contained 680 nonredundant sequences.
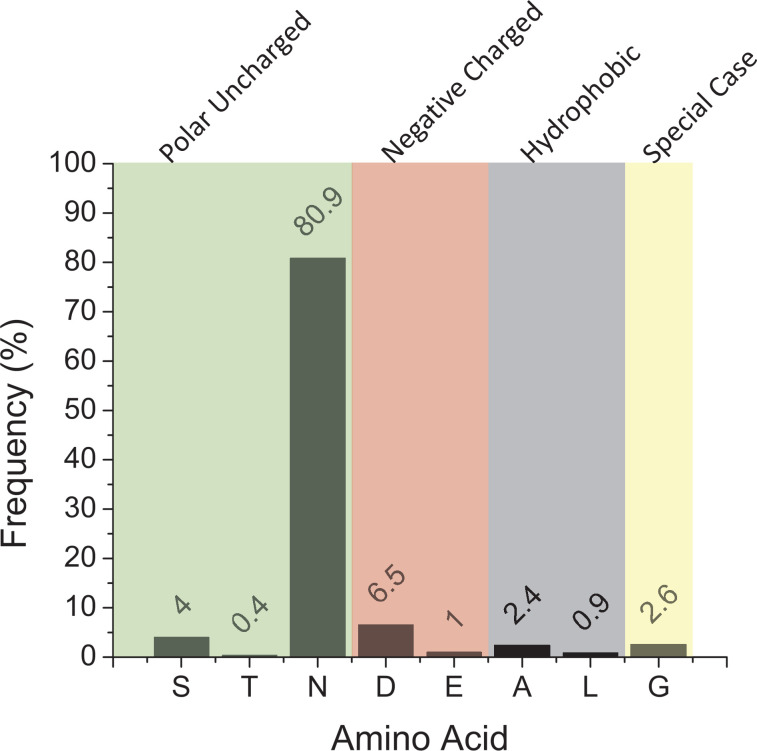
Figure 3—figure supplement 6. A bar graph representing the frequency of different amino acids in eukaryotes, and their side chain properties, at the position which would coordinate the Ca2+ ion observed in early cyanobacteria structures.

Figure 3—figure supplement 6.

This is made from 459 sequences.