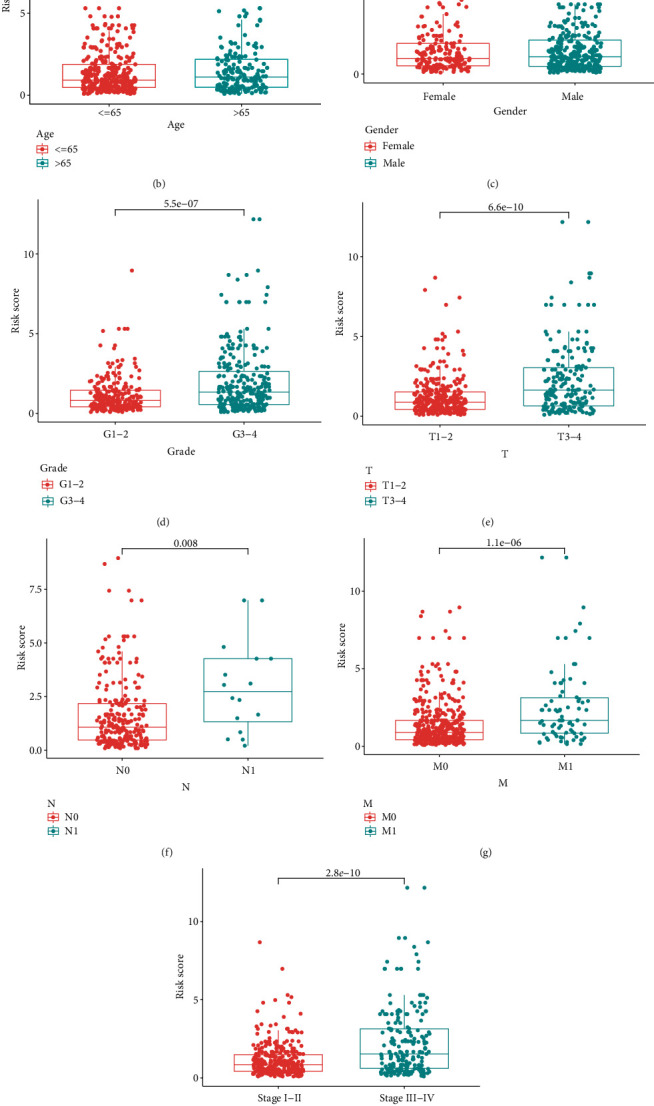
Figure 4.

Clinical evaluation by the risk assessment model. (a–j) A strip chart (a) along with the scatter diagram showed that (b) age and (c) gender were not significantly associated with the riskScore but (d) tumor grade, (e) T stage, (f) N stage, (g) M stage, and (h) clinical stage were significantly associated with the riskScore. (i) A univariate Cox hazard ratio analysis demonstrated that age (p < 0.001; HR = 1.032; 95% CI (1.018–1.045)), tumor grade (p < 0.001; HR = 2.279; 95% CI (1.859–2.795)), clinical stage (p < 0.001; HR = 1.863; 95% CI (1.633–2.126)), and riskScore (p < 0.001; HR = 1.389; 95% CI (1.316–1.465)) were statistically different. (j) age (p < 0.001; HR = 1.035; 95% CI (1.021–1.050)), tumor grade (p = 0.004; HR = 1.394; 95% CI (1.111–1.750)), clinical stage (p < 0.001; HR = 1.534; 95% CI (1.316–1.789)), and riskScore (p < 0.001; HR = 1.301; 95% CI (1.224–1.384)) also showed statistical differences by the multivariate Cox regression analysis.
