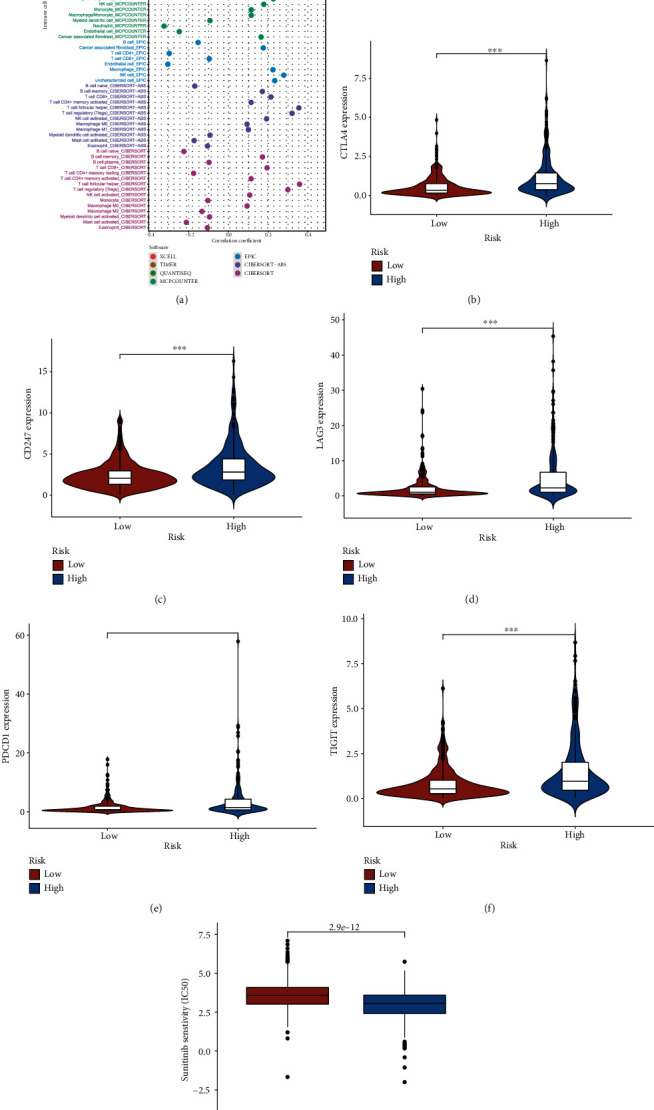
Figure 6.

Estimation of tumor-infiltrating immune cells and immunosuppressive molecules with risk assessment model. (a) Patients in the high-risk group were more positively associated with Tregs as shown by the Spearman correlation analysis. (b–e) High-risk scores were positively correlated with upregulated (b) CTLA4 expression, (c) CD247 expression, (d) LAG3 expression, (e) PDCD1 expression, and (f) TIGIT expression levels, and all these differences had statistical significance in patients with ccRCC. (g) The model acted as a potential predictor for chemosensitivity as high-risk scores were related to a lower IC50 for chemotherapeutics such as sunitinib.
