Figure 1.
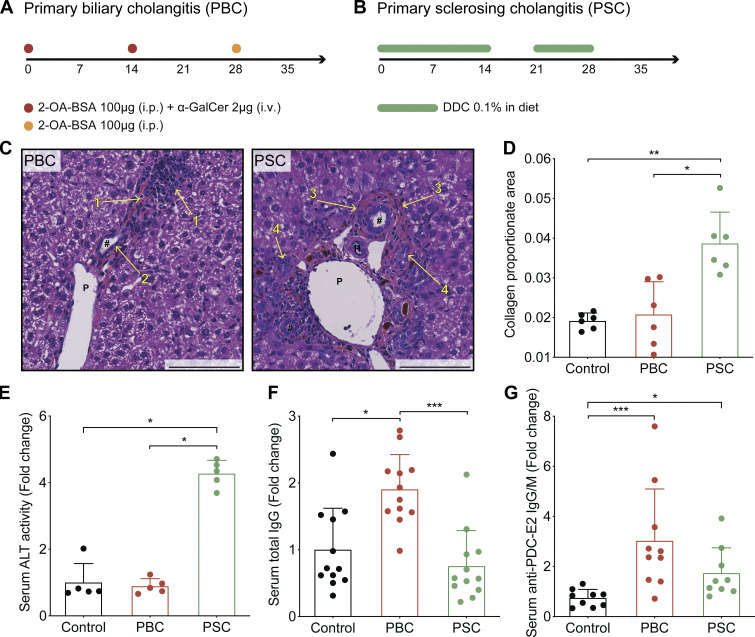
Previously characterized mouse models of PBC and PSC cholangitis do recapitulate the main features of the corresponding human pathologies. (A) Experimental schedule of the induction of PBC in C57Bl/6 mice. Mice were injected at days 0 and 14 with 2OA-BSA (i.p.) plus α-GalCer (i.v.). At day 28, mice received one more dose of 2OA-BSA (i.p.). (B) Experimental schedule of the induction of PSC in C57Bl/6 mice. Mice were fed a diet containing 0.1% DCC for 2 wk. Then, after 1 wk of recovery on regular food, animals were fed again the DDC-supplemented diet during the fourth week. (C) Paraffin-embedded sections of PBC and PSC mouse livers at day 35 of cholangitis induction, stained with hematoxylin, eosin, and safran. #, bile duct; H, hepatic arteria; P, portal vein; 1, infiltrated leukocytes; 2, hyperplastic bile duct; 3, onion skin–like fibrosis; 4, ductular reaction. Porphyrin plugs (dark red) are observable in PSC liver section. Scale bars correspond to 100 µm. (D) Collagen proportionate area measured on Sirius red-stained sections of control, PBC, and PSC mouse livers harvested at day 35 of cholangitis induction. For each group, n = 6. (E) Relative ALT activity measured in the serum of control, PBC, and PSC mice at day 35 of cholangitis induction. For each group, n = 5. One representative experiment out of two is shown. (F) Relative level of total circulating IgG measured in control, PBC, and PSC mice at day 36. For each group, n = 12. One representative experiment out of two is shown. (G) Relative level of IgG and IgM specific to PDC-E2 measured in the serum of control, PBC, and PSC mice at day 35 of cholangitis induction. For control, PSC, and PBC groups, n = 9, 9, and 10 samples, respectively, pooled from two distinct experiments. (D–G) Graphs show individual and mean (±SD) values. P values were calculated by means of the Kruskal–Wallis H test with Dunn’s pairwise multiple comparisons. *, P < 0.05; **, P < 0.01; ***, P < 0.001.

