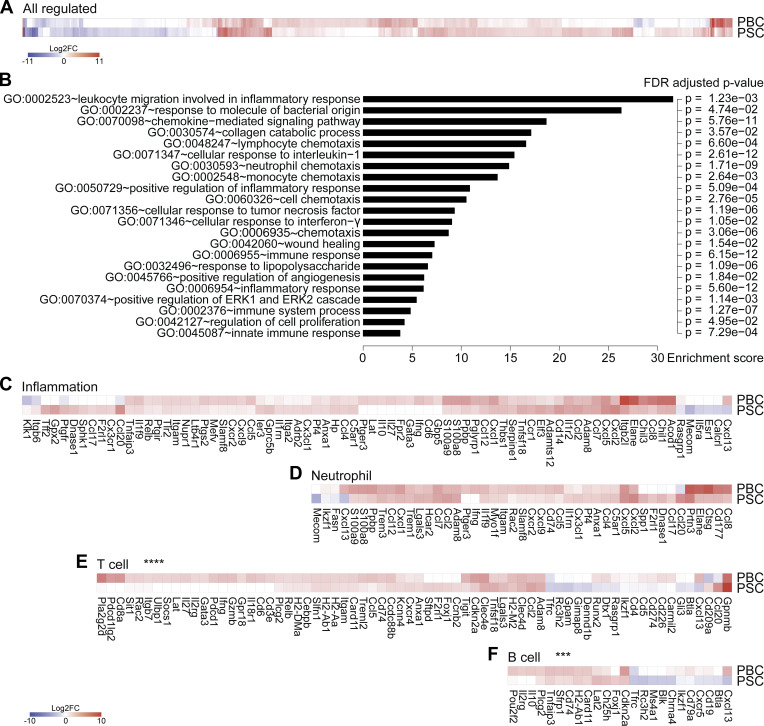
Figure 2.
Livers from mice with PBC and PSC feature distinct adaptive immune cell signatures. (A–F) Following the experimental schedules illustrated in Fig. 1, A and B, hepatic gene expression was studied by transcriptomic analysis (RNA-seq) in healthy control (n = 4), PBC (n = 3), and PSC (n = 3) mice at day 35. (A) Fold change (≥log2|2|) of the 866 significantly modulated genes in PBC and PSC livers relative to healthy controls. Refer to Data S1 for a detailed heatmap and to Table S1 for individual and mean expression values of each gene. (B) GO term enrichment analysis of the genes up-regulated in both PBC and PSC livers (of note, genes down-regulated were not associated with a specific GO term enrichment). The bar chart displays the enrichment score of significantly enriched GO terms with their FDR-adjusted P value. (C–F) Focus on genes whose expression is modulated in PBC and PSC livers compared with healthy controls and listed under the GO terms “inflammation” (C), “neutrophil” (D), “T cell” (E), and “B cell” (F). P values of the paired Student t test of the comparisons between PBC and PSC profiles are indicated. ***, P < 0.001; ****, P < 0.0001. FC, fold-change; FDR, false discovery rate.

