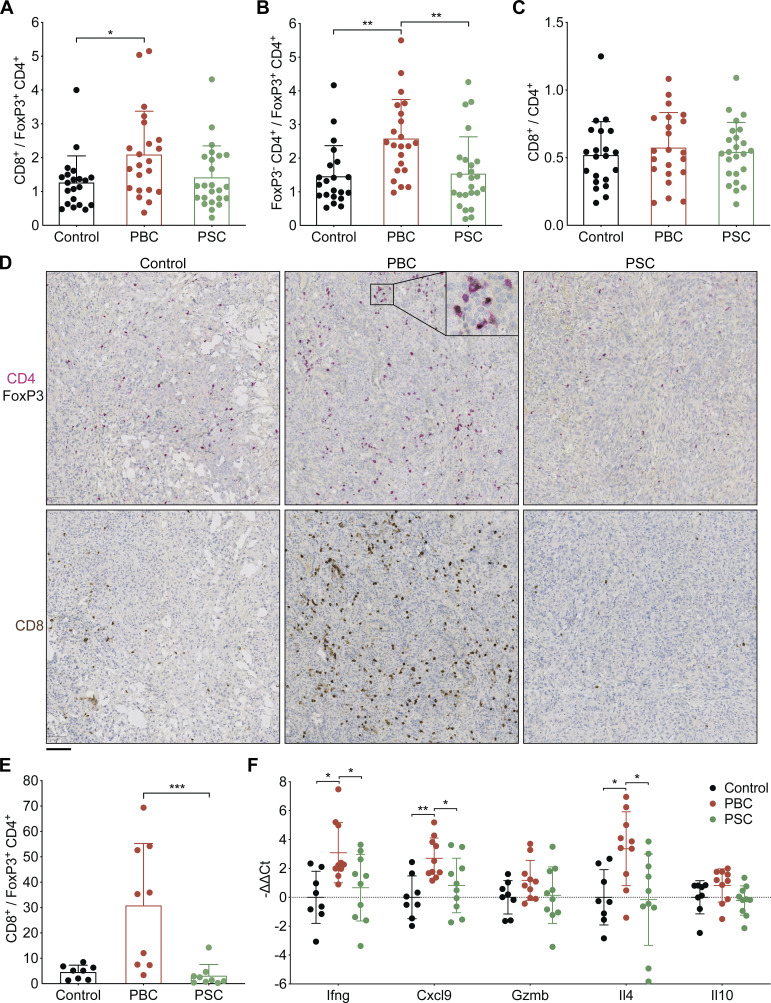
Figure 6.
PBC affects T lymphocyte subsets infiltrating CCA tumors. (A–F) Following the experimental schedule illustrated in Fig. 3 A, SB1-JP4 CCA tumors were collected from control, PBC, and PSC mice at day 56/60 after CCA engraftment. T cell subsets were analyzed by flow cytometry (A–C) and immunohistochemistry (D and E), and the expression of T cell–associated effector and regulatory cytokines was measured by RT-qPCR (F). Ratios of either total CD8+ CD3+ T cells (A) or FoxP3− CD4+ CD3+ T cells (B) over FoxP3+ CD4+ CD3+ T reg cells, and of total CD8+ CD3+ T cells over total CD4+ CD3+ T cells (C) within CCA tumors. (A–C) For control, PBC, and PSC groups, n = 21, 22, and 24 samples, respectively, pooled from three distinct experiments. (D and E) PFA-fixed paraffin-embedded sections of implanted CCA tumors from control, PBC, and PSC mice were stained for CD4 (magenta), FoxP3 (black), or CD8 (brown) by immunohistochemistry (D), and the ratio of CCA-infiltrating CD8+ over FoxP3+ CD4+ cells was measured (E). (D) Scale bar corresponds to 100 µm. (E) For control, PBC, and PSC groups, n = 8, 9, and 9 samples, respectively, pooled from two experiments. (F) Relative expression of several genes encoding Th1/Tc1 (Ifng, Cxcl9, Gzmb) or Th2/Tc2 (Il4)-related effector or regulatory (Il10) molecules within CCA tumors. For control group, n = 8, and for PBC and PSC groups, n = 10 samples pooled from two experiments. Graphs show individual and mean (±SD) values. P values were calculated by means of the Kruskal–Wallis H test with Dunn’s pairwise multiple comparisons (A–C and E) or one-way ANOVA with Tukey’s pairwise multiple comparisons (F). *, P < 0.05; **, P < 0.01; ***, P < 0.001. Trend toward statistical significance was observed for the following comparisons: PBC versus PSC: P = 0.1218 (A); control versus PBC: P = 0.0646 (E); for Il10: PBC versus PSC: P = 0.1073 (F). PFA, paraformaldehyde.

