Figure 9.
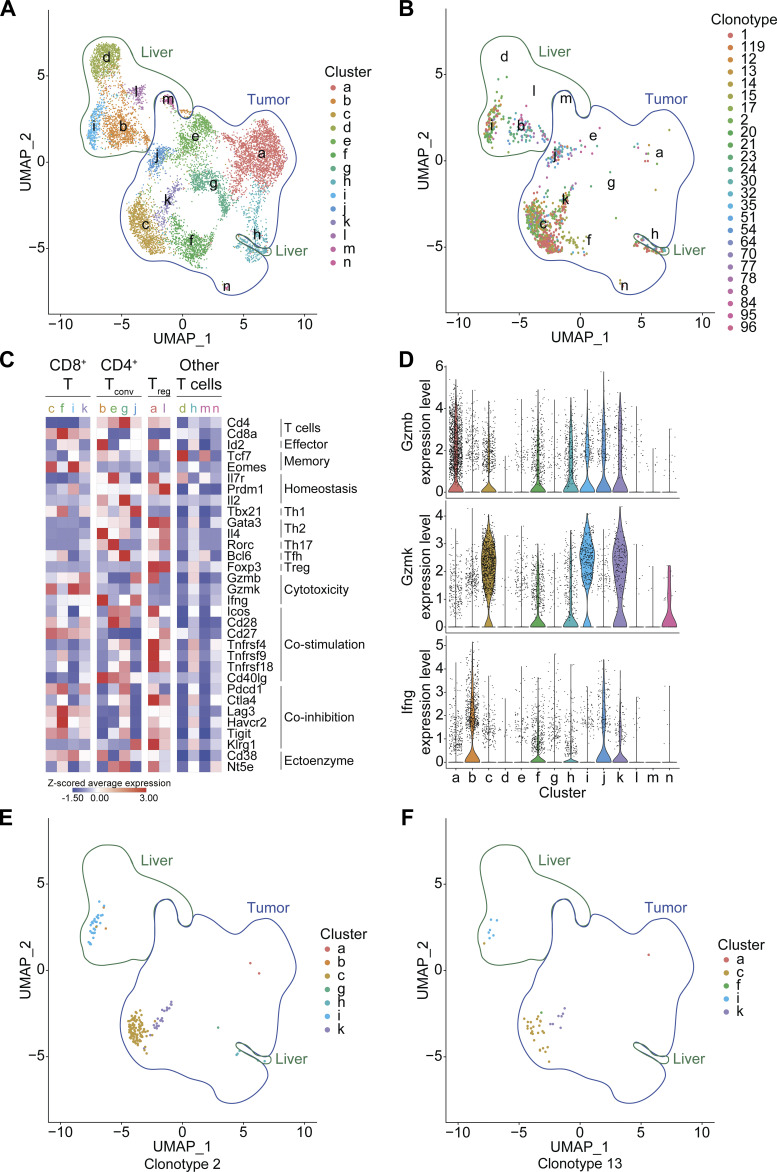
Phenotype of the T cell clonotypes involved in PBC-elicited CCA immunosurveillance. (A–F) In silico analyses of scRNA-seq/scTCR-seq data revealed the phenotype of the 25 T cell clonotypes enriched in both liver and CCA tumor of a PBC mouse (Fig. 8 D). (A) Uniform manifold approximation and projection (UMAP) clustering projection of the total T lymphocytes sorted out from the tumoral and hepatic tissues of a PBC mouse. 14 phenotypic T cell clusters were detected (a–n). (B) UMAP clustering projection of the 25 T cell clonotypes enriched in both tumor and liver upon PBC. (C) Z-scored average expression of several genes associated with T cell function across the 14 clusters, consisting of four CD8+, four conventional (conv) CD4+, two regulatory (reg) CD4+, and four unassigned T cell clusters. (D) Violin plots displaying the expression level of Gzmb, Gzmk, and Ifng across the 14 clusters. (E and F) UMAP clustering projection of the T cell clonotypes #2 (E) and #13 (F) that were the most enriched in both CCA tumor and liver of the PBC mouse (Fig. 8 D).

