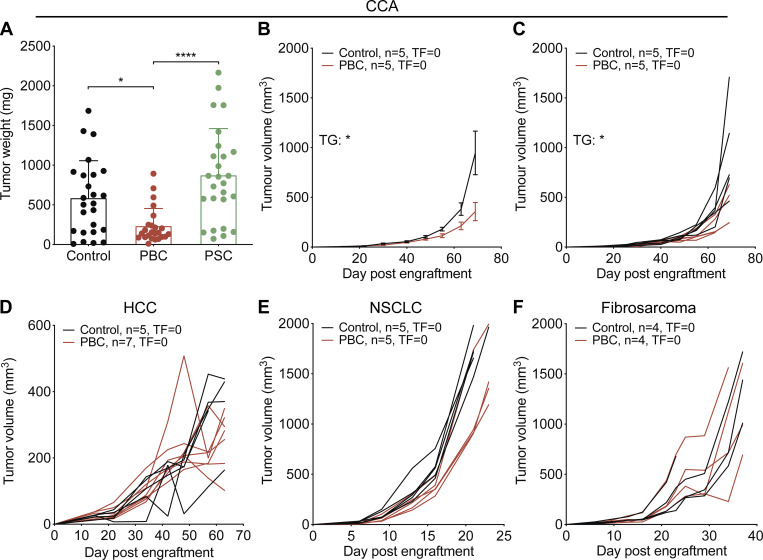
Figure S1.
PBC but not PSC prevents specifically the outgrowth of ectopic CCA. (A–F) Following the experimental schedules illustrated in Fig. 1, A and B, syngeneic cancer cells were engrafted through s.c. injection 1 wk after the end of cholangitis induction, and tumor growth followed. (A) Weight of CCA tumors implanted in control, PBC, and PSC mice at day 56/60 after SB1-JP4 cell line engraftment. Graph shows mean (±SD) values. P values were calculated by means of the Kruskal–Wallis H test with Dunn’s pairwise multiple comparisons. For control, PBC, and PSC groups, n = 25, 24, and 26 tumors, respectively, pooled from three distinct experiments. (B–F) Growth of transplanted CCA SB1 (B and C), HCC (D), NSCLC (E), and fibrosarcoma (F) tumors in control and PBC mice. (B and C) For each group, n = 5. (D) For control and PBC groups, n = 5 and 7, respectively. (E) For each group, n = 5. (F) For each group, n = 4. Graphs show mean (±SEM) (B) or individual (C and D–F) tumor growth curves. For comparing the tumor growth (TG) curves or the rates of tumor-free (TF) mice, tumor growth and tumor-free P values were calculated by means of a linear mixed-effects model or Fisher’s exact test, respectively. *, P < 0.05; ****, P < 0.0001.

