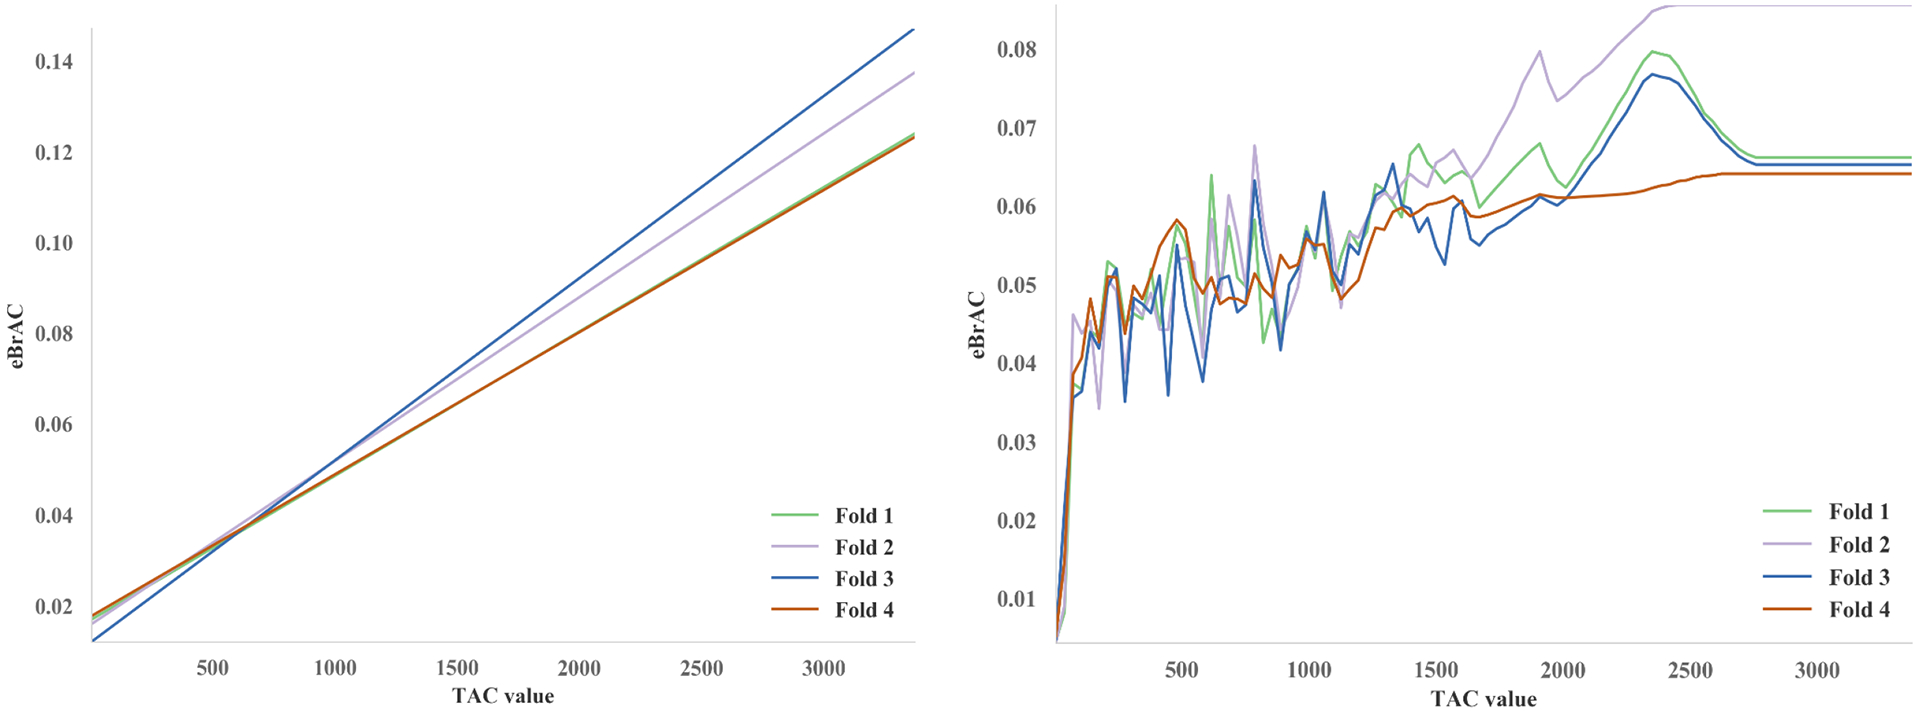
Figure 2.

The relationship between a single TAC measurement and BAC as estimated using linear regression (left) and Extra-Trees machine-learning (right). “Fold”s refer to portions of the dataset held out for testing during four-fold cross validation. In the case of a single TAC measurement, the machine learning model predicted ~0% eBAC for TAC values close to 0, and a gradually increasing TAC–eBAC relationship for higher values (with noise due to measurement error, individual differences, and other causes).
