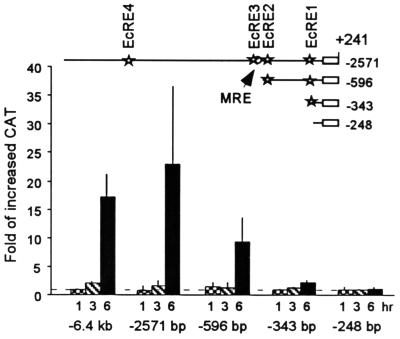
FIG. 5.
Transient transfection assays of MHR3 promoter activity as determined by the increase in CAT protein after exposure to 2 μg of 20E per ml for 1 ( ), 3 (▧), or 6 (■) h over the uninduced level at 0 h (set at 1). The deletion constructs tested are shown in the map above. Stars, putative EcRE; open circle, GGGTCA sequence. Means ± standard deviations (error bars) are shown (n = 3).

