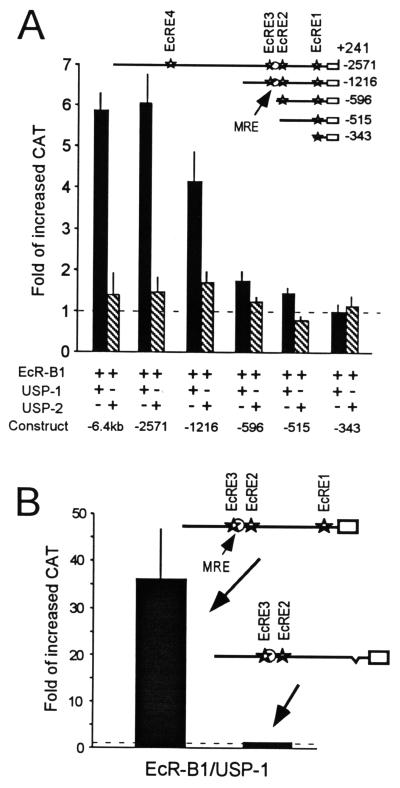
FIG. 6.
(A) Effects of increased levels of EcR-B1 and either USP-1 or USP-2 on 20E induction of MHR3 promoter activity. The pIE1hr expression vectors for EcR-B1 and USP-1 or USP-2 were cotransfected with the MHR3 promoter. Solid bars, EcR-B1–USP-1; hatched bars, EcR-B1–USP-2. (B) Reduction of 20E-induced promoter activity by the deletion of EcRE1. EcRE1 was deleted from the −1,216-bp promoter, and then either this or the parent construct was cotransfected with the pIE1hr expression vectors for EcR-B1 and USP-1. Transfection assays for MHR3 promoter activity were done 48 h after the cotransfection and 3 h after exposure to 2 μg of 20E per ml as described in Materials and Methods. Constructs are shown in the maps above the figures. Stars, putative EcRE; open circle, GGGTCA sequence (MRE). Means ± standard deviations (error bars) are shown (n = 3). Fold increased CAT was determined as in Fig. 5.

