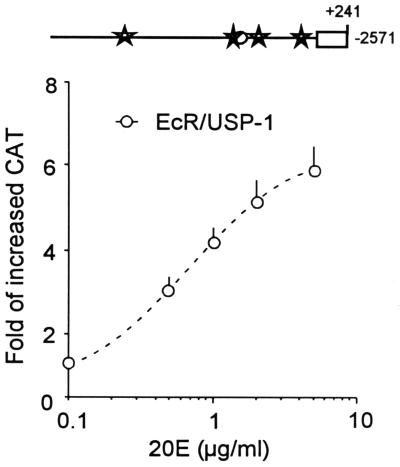
FIG. 7.
Concentration-response curves for the −2,571-bp MHR3 promoter construct cotransfected with pIE1hr–EcR-B1 and pIE1hr–USP-1. Forty-five hours later, cells were treated with the given concentration of 20E for 6 h, and then the CAT level was assessed as in Fig. 5. Means ± standard deviations (error bars) are shown (n = 3).

