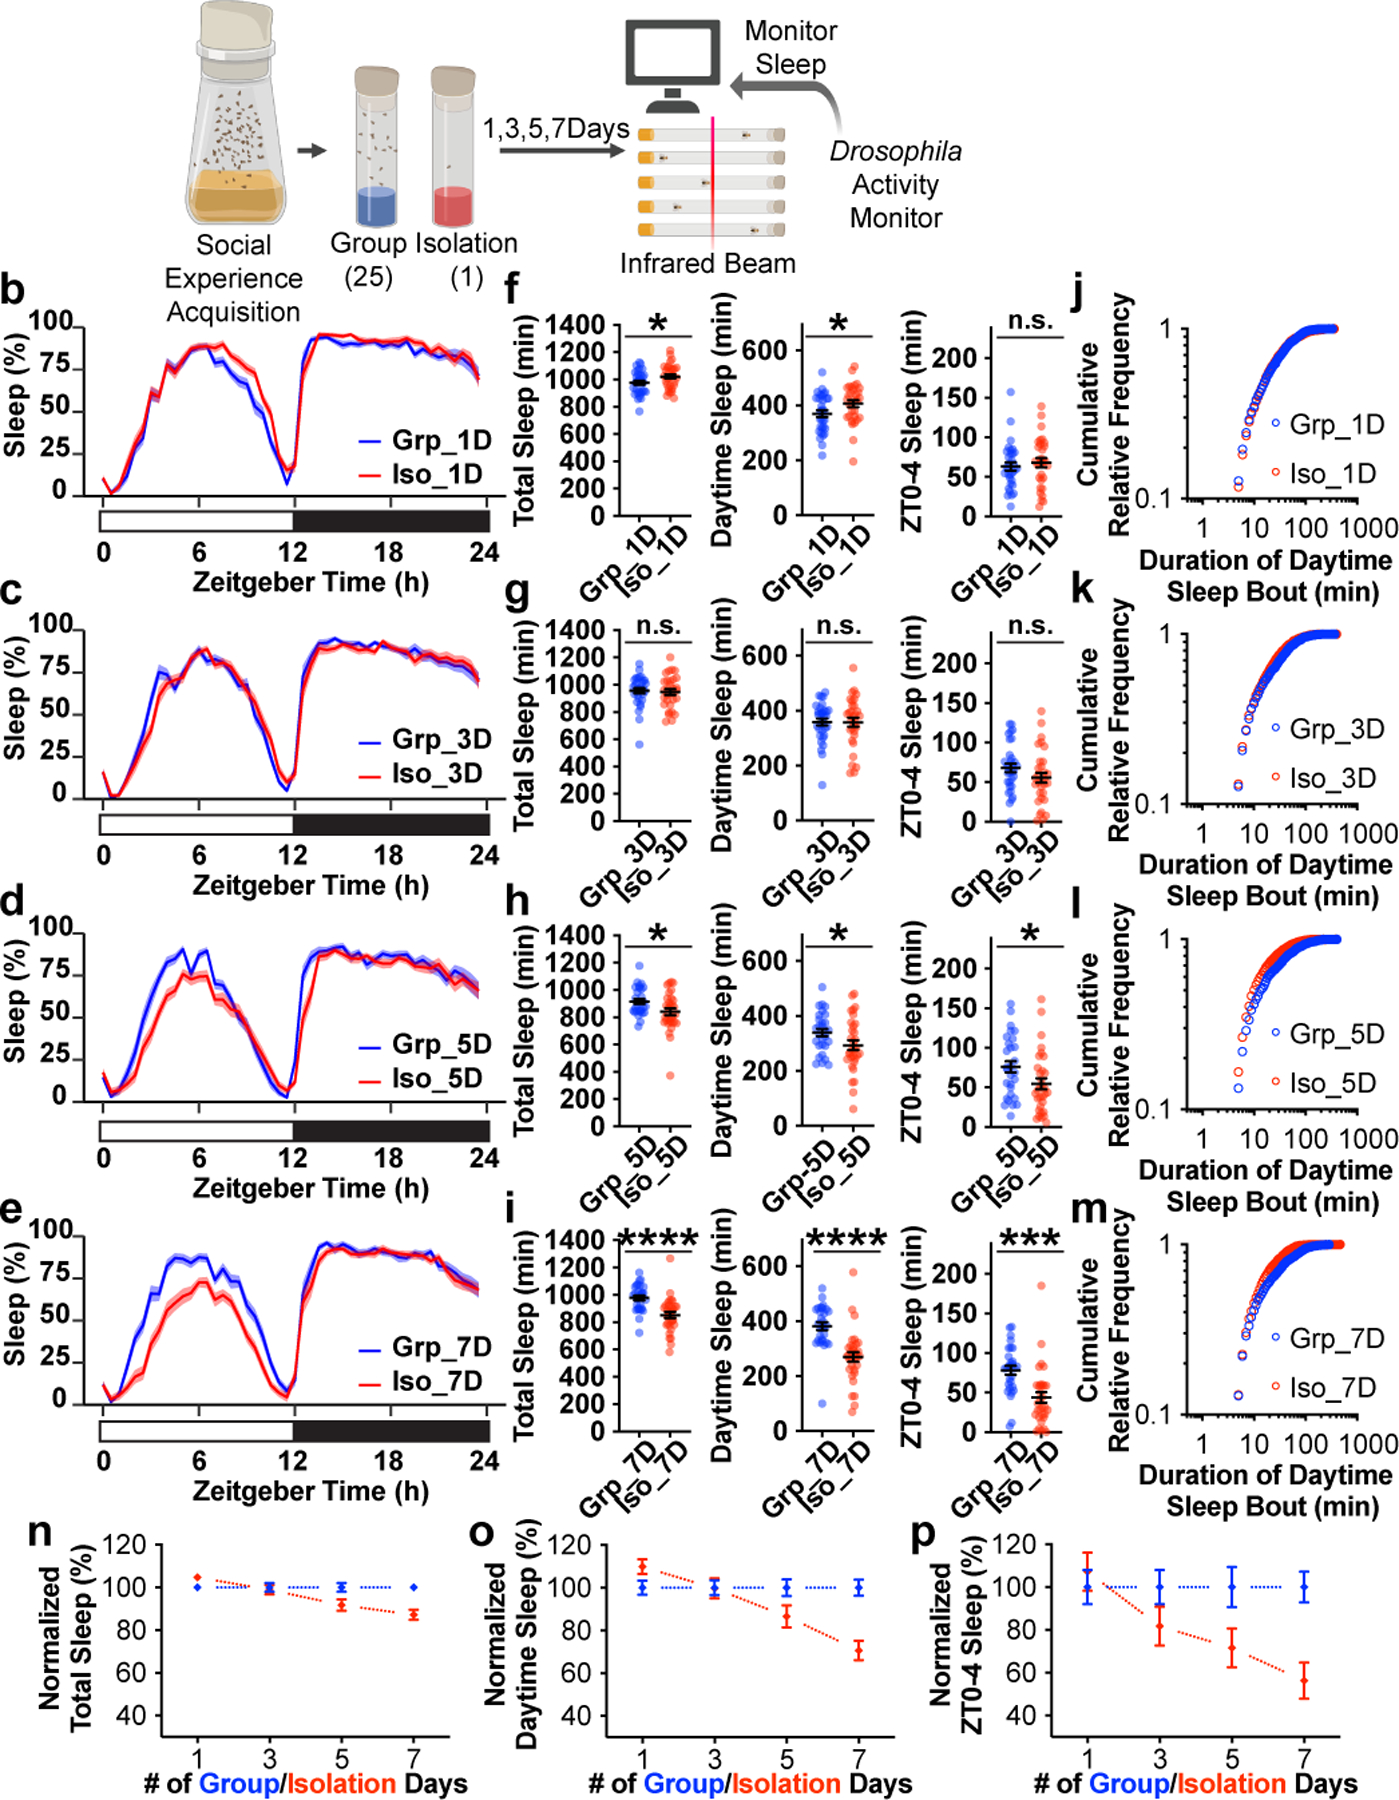
Fig. 1: Sleep is reduced by chronic but not acute social isolation in Drosophila.

a, Schematics of measuring sleep using Drosophila Activity Monitors after 1, 3, 5 or 7 days of group enrichment/social isolation. b–e, Sleep profiles (displayed as the average proportion of time spent sleeping in consecutive 30min segments during a 24hr LD cycle; solid line, Mean; shaded area, ±SEM) of flies after 1 (b), 3 (c), 5 (d) and 7(e) days of group enrichment/social isolation. f–i, Quantification (Mean±SEM with individual data points) of daily total sleep, daytime sleep and ZT0-4 sleep for flies after 1 (f), 3 (g), 5 (h) and 7(i) days of group enrichment/social isolation. j–m, Plots of cumulative relative frequency for distributions of daytime sleep bouts for flies after 1(j), 3 (k), 5 (l) and 7(m) days of group enrichment/social isolation. (See Extended Data Fig. 2a–d for density plots of the same dataset). n–p, Normalized (Mean±SEM) daily total sleep (n), daytime sleep (o), and ZT0-4 sleep (p) along social isolation/group enrichment process of up to 7 days. For each group enrichment/social isolation duration, sleep parameters for socially isolated animals were normalized to its group-treated counterparts. For b–i and n-p, N=29–32 animals; two-sided unpaired t-tests with Welch’s correction; *P<0.05, **P<0.01, ***P<0.001, ****P<0.0001. For N and P values, see the Source Data.
