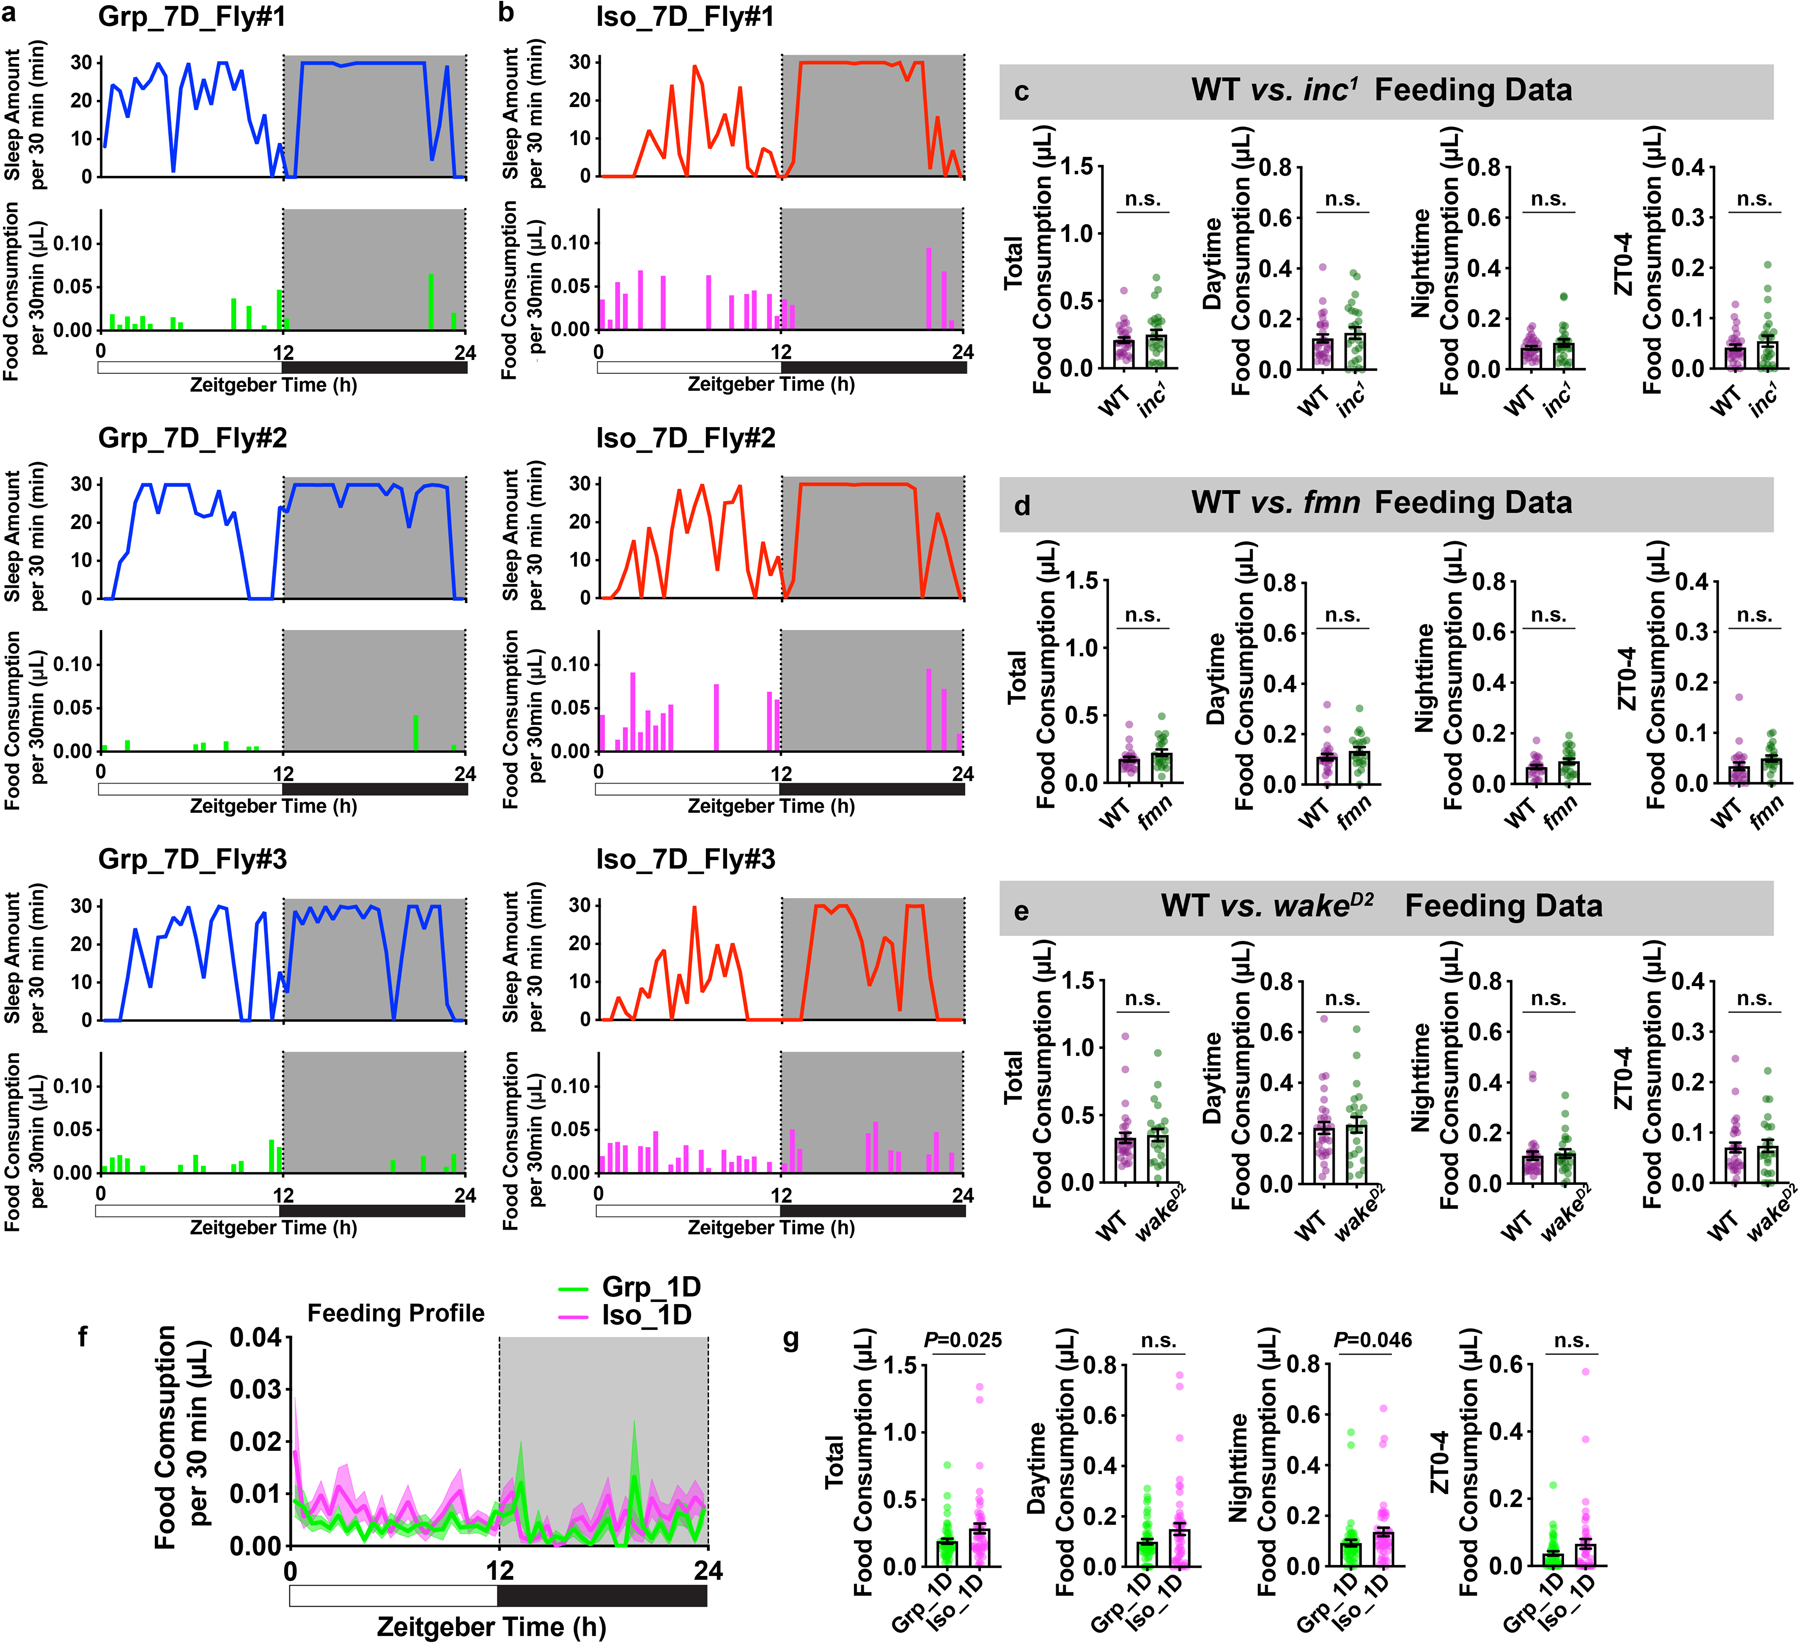
Extended Data Fig. 6. Chronic social isolation results in reduced sleep and excessive feeding, while food consumption is not altered in sleep mutants or after acute social isolation.

a, Sleep profiles and matching feeding profiles of three representative individual animals after 7 days of group enrichment. b, Sleep profiles and matching feeding profiles of three representative individual animals after 7 days of social isolation. Sleep profile is presented as sleep amount (min) in consecutive 30min segments during a 24hr LD cycle. Matching feeding profile is presented as food consumption (μL) in consecutive 30min segments during a 24hr LD cycle. c, Quantification of daily total food consumption, daytime food consumption, nighttime food consumption and ZT0-4 food consumption for wild type and sleep mutant inc1 flies (N=25–29 animals). d, Quantification of daily total food consumption, daytime food consumption, nighttime food consumption and ZT0-4 food consumption for wild type and sleep mutant fmn flies (N=25–29 animals). e, Quantification of daily total food consumption, daytime food consumption, nighttime food consumption and ZT0-4 food consumption for wild type and sleep mutant wakeD2 flies. (N=23–30 animals). f, Feeding profile measured by ARC (Activity Recording Capillary Feeder) assay in flies following 1 day of group enrichment/social isolation; solid line, Mean; shaded area, ±SEM. g, Quantification of daily total food consumption, daytime food consumption, nighttime food consumption and ZT0-4 food consumption for flies after 1 day of group enrichment/social isolation (f–g, N=49–50 animals). All quantifications are displayed as Mean±SEM with individual data points. Unpaired t-tests with Welch’s correction. For N and P values, see the Source Data.
