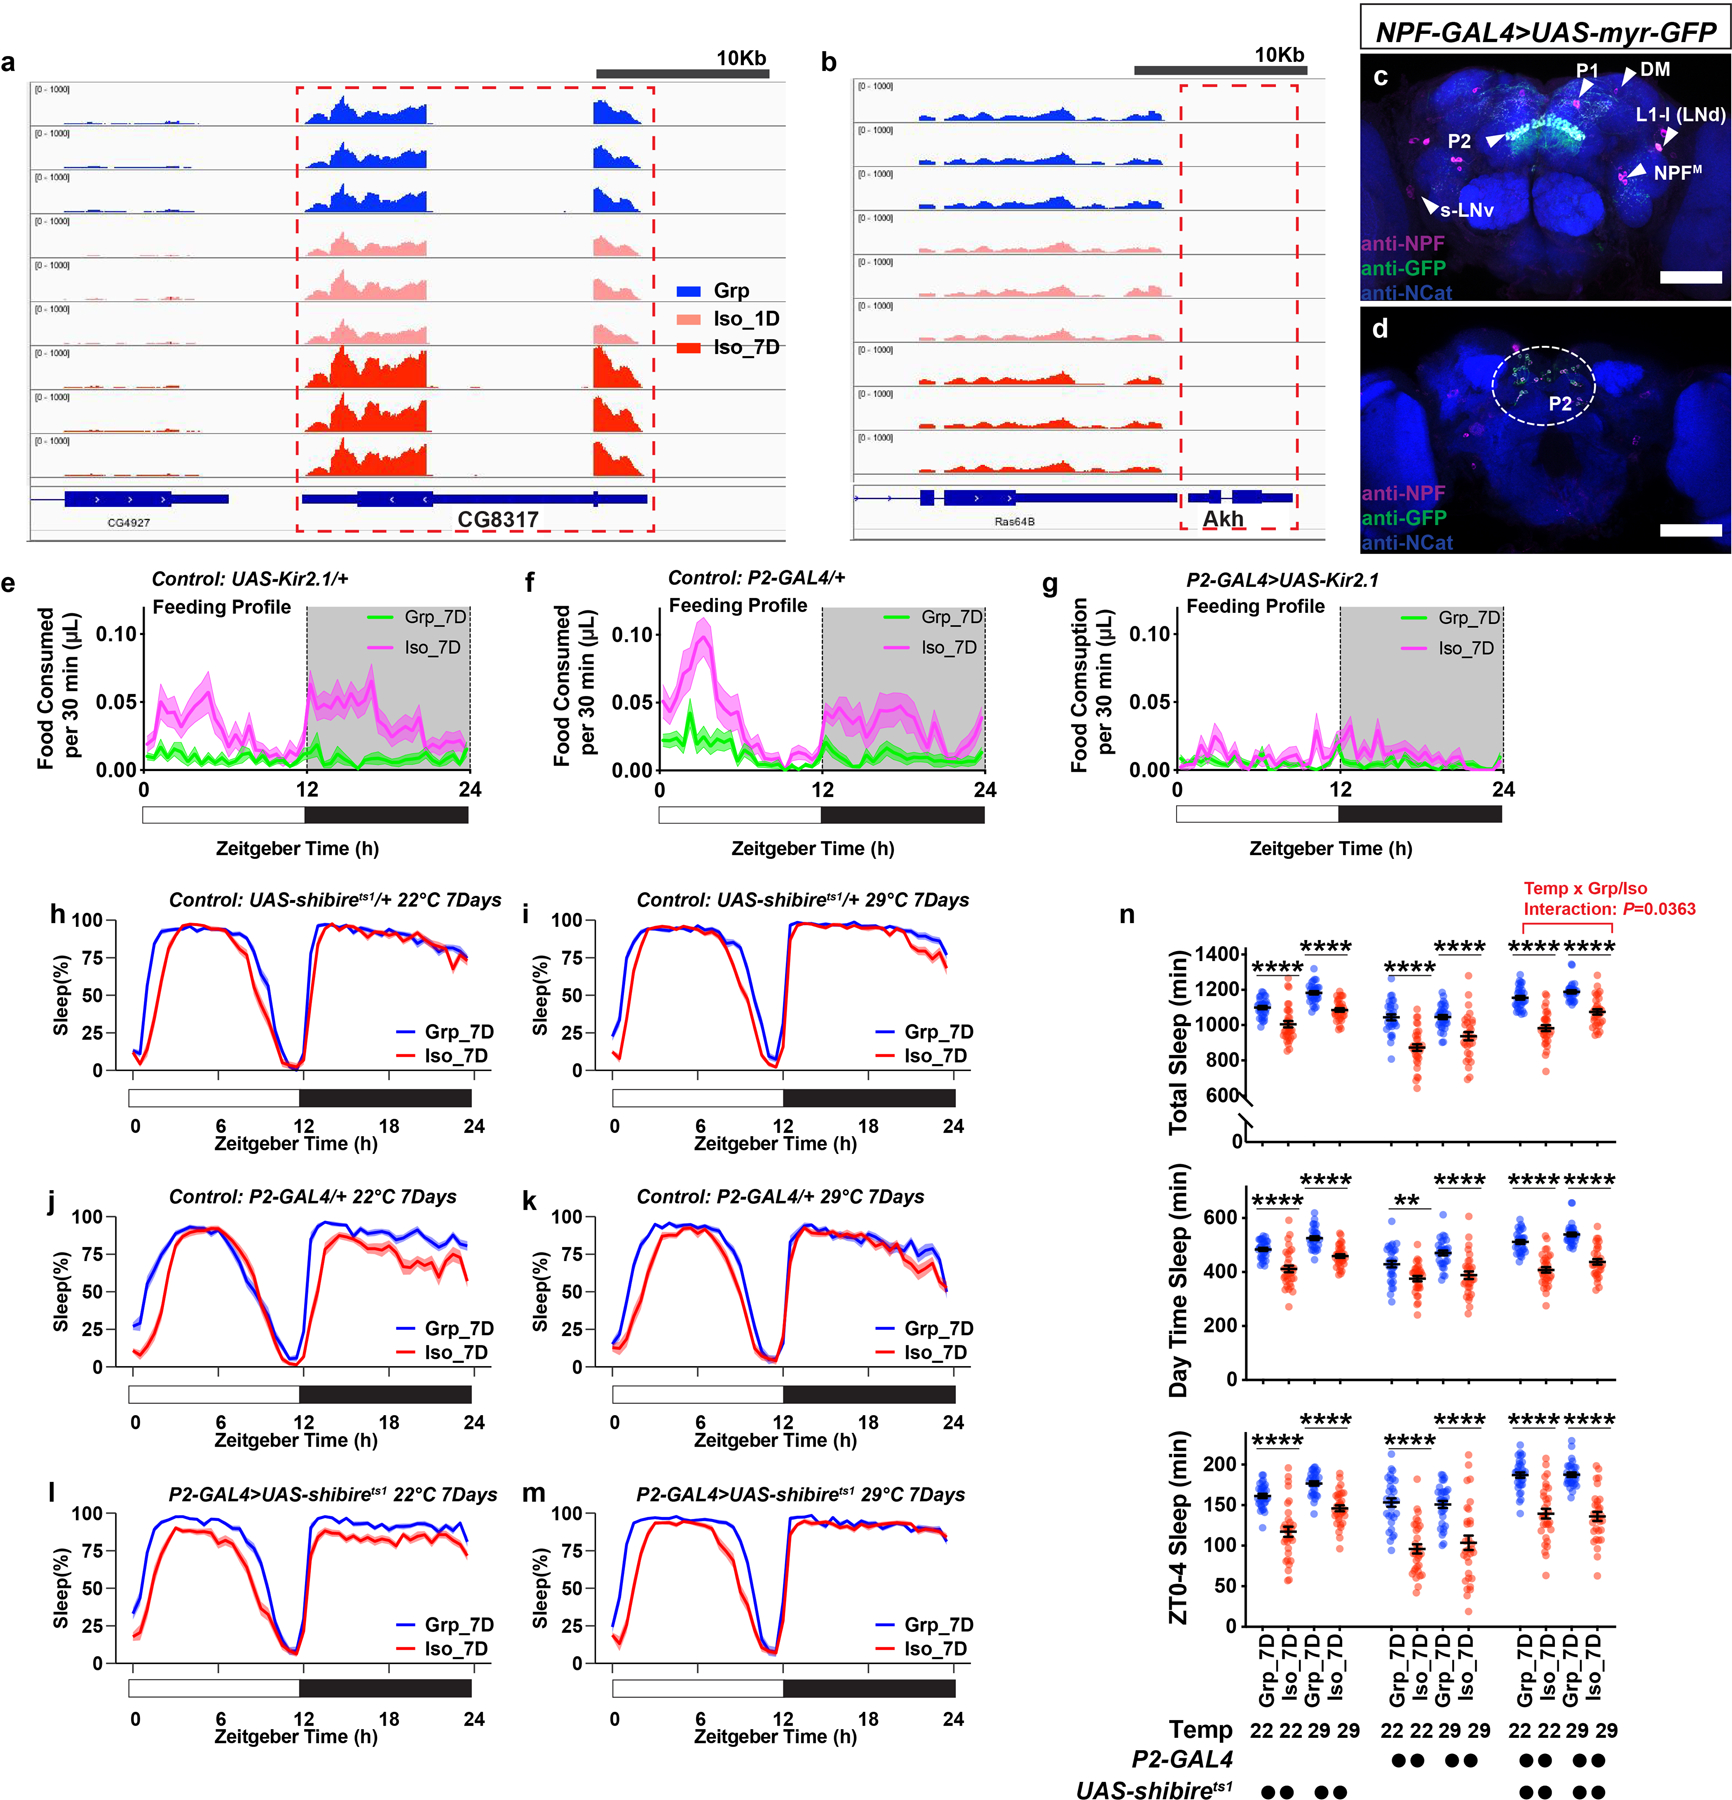
Extended Data Fig. 7. Limostatin transcripts are detected in fly head RNA-seq sample libraries; NPF-GAL4 expression pattern; feeding profile of flies in experiments silencing P2 neurons; and silencing P2 neurons with UAS-shibirets1 during social isolation is insufficient to block chronic social isolation-induced sleep loss.

a, Reads from RNA-seq sample libraries (Grp, Iso_1D, and Iso_7D) align to the gene region of Limostatin (CG8317). b, Akh and Lst were known to co-express in the corpora cardiaca13. No reads were detected or aligned to the gene region of Akh, suggesting the RNA-seq samples are free of corpora cardiaca materials and the measured Lst transcripts come from sources in the brain. c, Expression pattern of NPF-GAL4 labeled neurons revealed by UAS-myr::GFP and NPF antibody staining. NPF-immunoreactivity-positive cells overlaps with GFP-positive cells. Triangles indicate P1, P2, DM, L1-l (or LNd)22, s-LNv44 and NPFM45 neurons. d, An additional brain imaged from the posterior end to show NPF and GFP-positive cell bodies of P2 neurons, circled in the dashed line (Magenta: NPF; Green: GFP; Blue: N-cadherin; scale bar: 50μm). e–g, Feeding profiles measured by ARC (Activity Recording Capillary Feeder) assay for parental control flies (e and f) and flies expressing UAS-Kir2.1 with P2-GAL4 (g) following 7 days of group enrichment/social isolation; solid line, Mean; shaded area, ±SEM (N=27–30 animals). h–m, Sleep profiles for parental control flies (h–k) and flies expressing UAS-shibirets with P2-GAL4 (l and m) following 7 days of group enrichment/social isolation at 22°C (h, j, l) or 29°C (i, k, m). All sleep behavior was tested at 22°C. n, Quantification (Mean±SEM with individual data points) of daily total sleep, daytime sleep and ZT0-4 sleep for parental control flies and flies expressing UAS-shibirets with P2-GAL4 following 7 days of group enrichment/social isolation at 22°C or 29°C. Sleep profiles are displayed as the average proportion of time spent sleeping in consecutive 30min segments during a 24hr LD cycle; solid line, Mean; shaded area, ±SEM. For h–n, N=31–32 animals; two-way ANOVA were used for detecting interactions between temperature treatment and group/isolation status; Šidák multiple comparisons tests were used for post-hoc analyses between group treated and isolated animals of the same genotype and temperature treatment; *P<0.05, **P<0.01, ***P<0.001, ****P<0.0001. For N and P values, see the Source Data.
