
Fig. 2: Chronic social isolation induces a starvation gene expression program and results in excessive feeding.
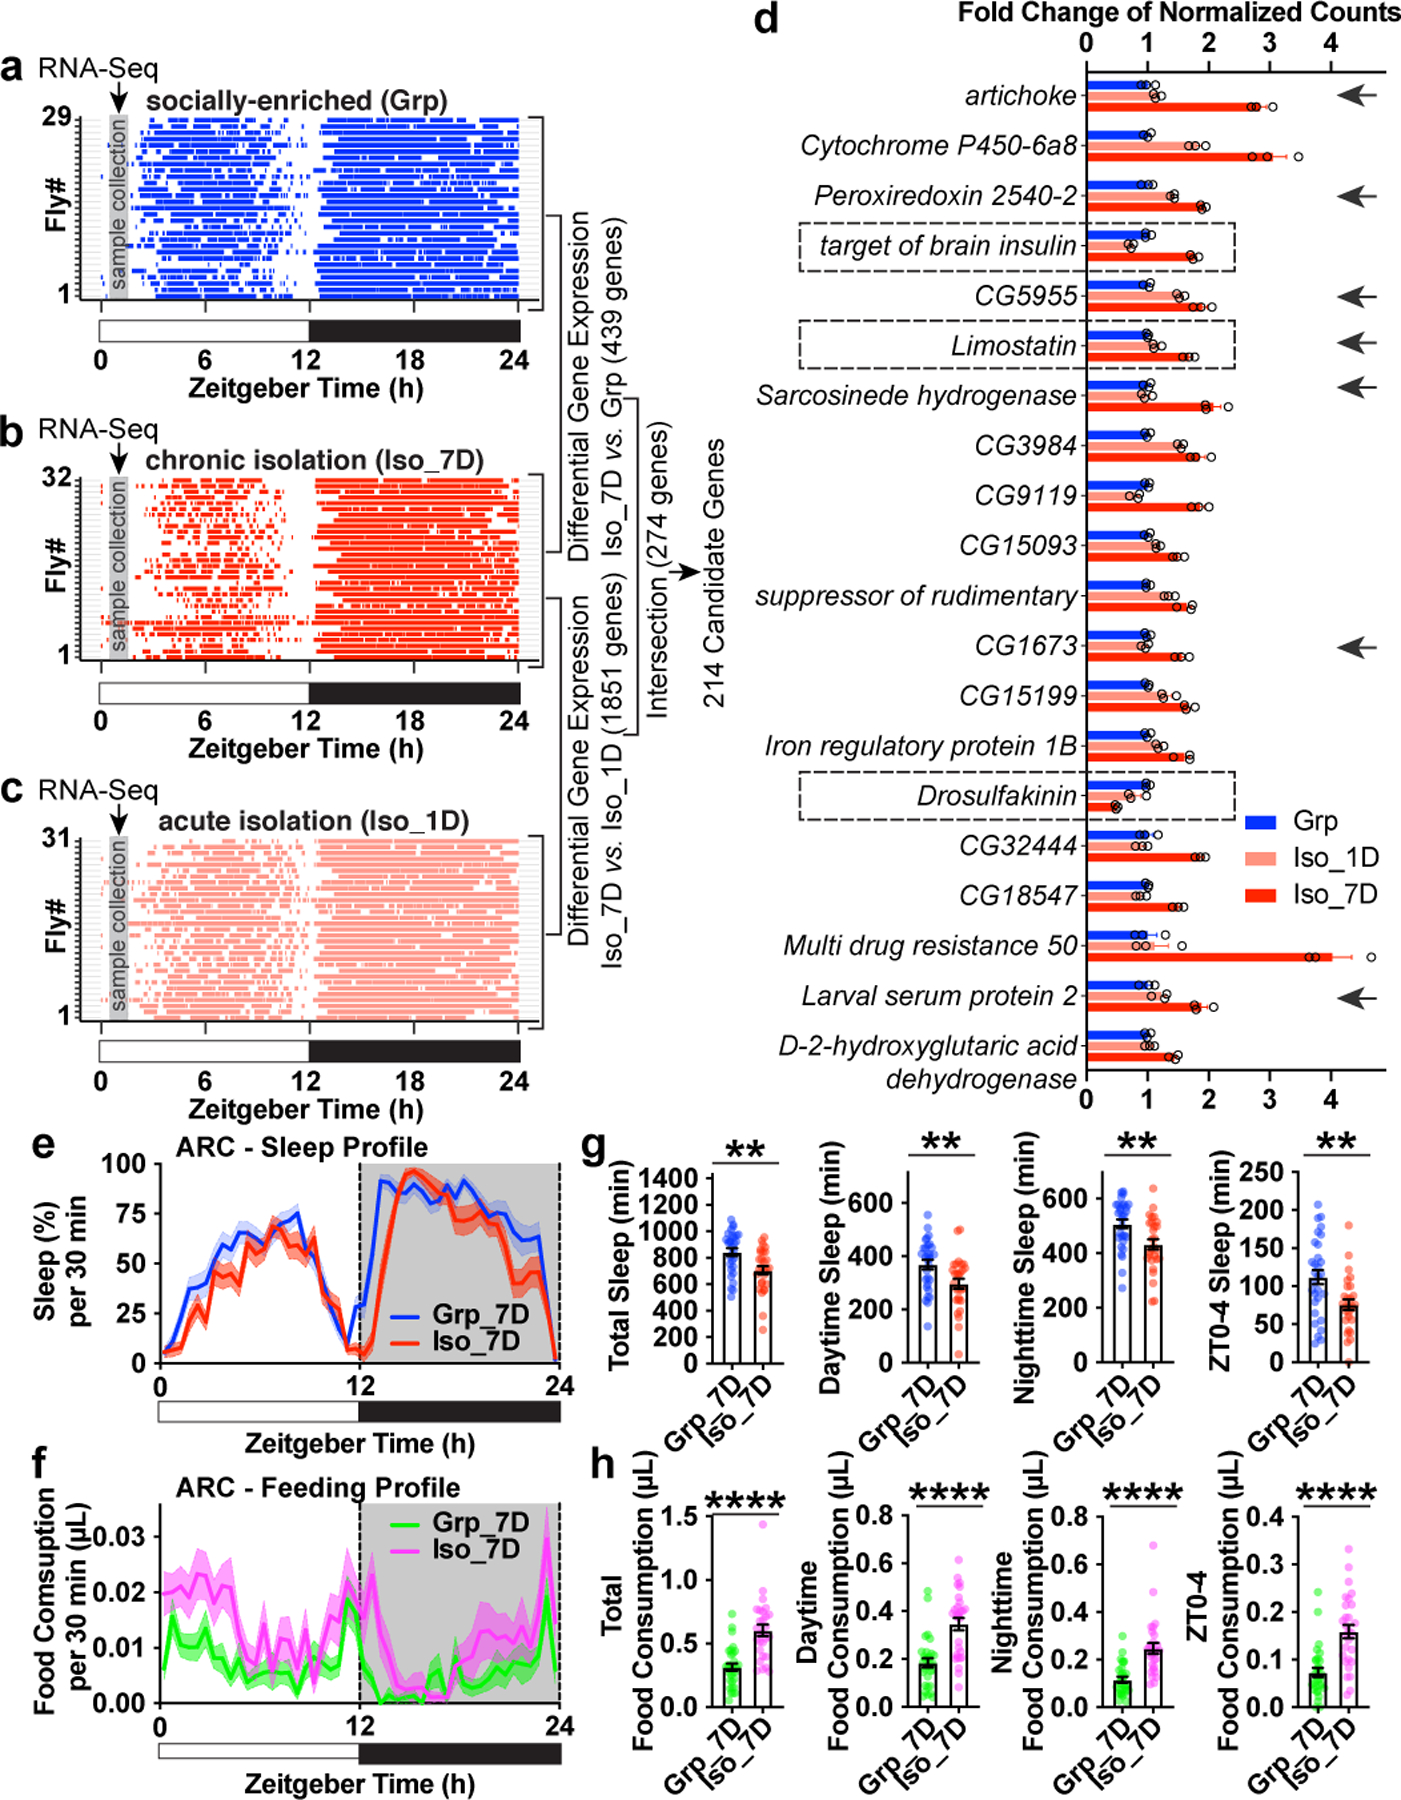
a–c, Raster plot of sleep bouts of individual animals after group enrichment (Grp) (a), 1 day acute social isolation (Iso_1D) (c) and 7 days chronic social isolation (Iso_7D) (b). Each row is an individual animal, with each colored bar representing sleep bouts within a 24hr LD cycle (blue for group enrichment, red for chronic social isolation and light red for acute social isolation). Gray vertical bars indicate a ~1.5hr time window (ZT0.5-ZT2) used for collecting fly heads for RNA-Seq. 29–32 representative animals are shown for each condition. Differential gene expressions were conducted between “Iso_7D vs. Grp” and “Iso_7D vs. Iso_1D”. 274 genes were identified within the intersection of these two comparisons. 214 candidate genes were identified using a clustering approach (Extended Data Fig. 5 and Supplemental Information). d, Fold changes (Mean±SEM) of normalized counts of the top 20 candidate genes (ranked by adjusted P-value in the comparison of “Iso7 vs. Grp”) (N=3 samples). Arrows indicate genes that are regulated after 24hr starvation16. e–f, Sleep (e) and feeding (f) measured by ARC (Activity Recording Capillary Feeder) assay in flies following 7 days of group enrichment/social isolation. Sleep profile is presented as the average proportion of time spent sleeping in consecutive 30min segments during a 24hr LD; Solid line, Mean; Shaded area, ±SEM. Matching average feeding profile is presented as average food consumption (μL) in consecutive 30min segments during a 24hr LD cycle; Solid line, Mean; Shaded area, ±SEM. g, Quantification (Mean±SEM with individual data points) of daily total sleep, daytime sleep, nighttime sleep and ZT0-4 sleep for flies after 7 days of group/social isolation treatment. h, Quantification (Mean±SEM with individual data points) of daily total food consumption, daytime food consumption, nighttime food consumption and ZT0-4 food consumption for flies after 7 days of group enrichment/social isolation. For e-h, N=28–30 animals; two-sided unpaired t-tests with Welch’s correction; *P<0.05, **P<0.01, ***P<0.001, ****P<0.0001. For N and P values, see the Source Data.