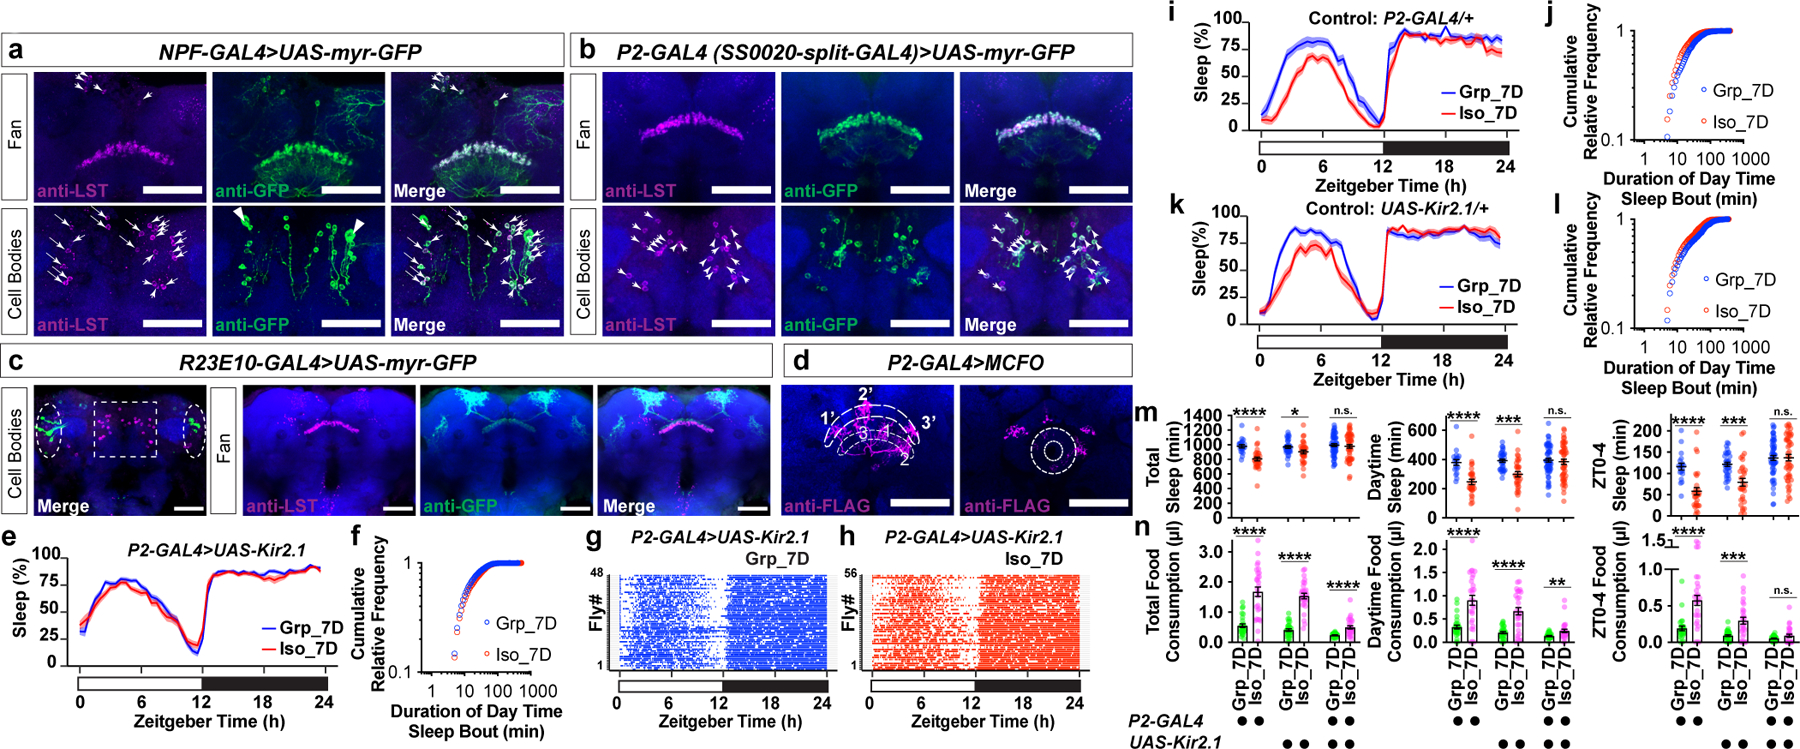
Fig. 3: P2 neurons are required for chronic social isolation-induced sleep loss.

a, LST-immunoreactivity-positive cells overlaps NPF-GAL4-labelled fan-shaped body neurons at fan layer and cell bodies levels. Arrowheads: LST-immunoreactivity-positive cell bodies (magenta) that are also NPF-GAL4 positive (green). Triangles: NPF P1 neurons. b, LST-immunoreactivity-positive cells overlap P2-GAL4(SS0020-split-GAL4)-labelled NPF P2 neurons at fan layer and cell bodies levels. Arrowheads indicate the majority of LST-immunoreactivity-positive cell bodies (magenta) are also P2-GAL4-positive (green), consistent with previous report that P2-GAL4 labels ~85% NPF P2 neurons22. c, Expression pattern of R23E10-GAL4 (dashed ovals: cell bodies) and distribution of LST-immunoreactivity-positive cells (dashed square: cell bodies) (a–d, blue: N-cadherin, scale bar: 50μm). d, Fan-shaped body projections of three P2 neurons are decorated by FLAG tag (magenta). Each arborizes at a column of the lower layer of the FB (thinner dashed line) and projects to a different column of the higher layer of the FB (thicker dashed line, projections: 1->1’, 2->2’, 3->3’). These three neurons also arborize at the ellipsoid body level (donut-shaped area) (blue: Bruchpilot, scale bar: 50μm). e–h, Sleep profile (e), sleep bouts distributions (f) and sleep bouts raster plots (g and h) of flies expressing UAS-Kir2.1 with P2-GAL4 after group enrichment/social isolation for 7 days (N=48–56 animals). i–l, Sleep profile (i, k) and sleep bouts distributions (j, l) of parental control flies after group enrichment/social isolation for 7 days (N=19–32 animals). m, Quantification (Mean±SEM with individual data points) of daily total sleep, daytime sleep and ZT0-4 sleep for all experimental and heterozygous control flies. n, Quantification (Mean±SEM with individual data points) of daily total, daytime, and ZT0-4 food consumption for all experimental and heterozygous control flies (N=27–30 animals). Sleep profiles are displayed as the average proportion of time spent sleeping in consecutive 30min segments during a 24hr LD cycle; solid line, Mean; shaded area, ±SEM. For m–n, two-sided unpaired t-tests with Welch’s correction; *P<0.05, **P<0.01, ***P<0.001, ****P<0.0001. For N and P values, see the Source Data.
