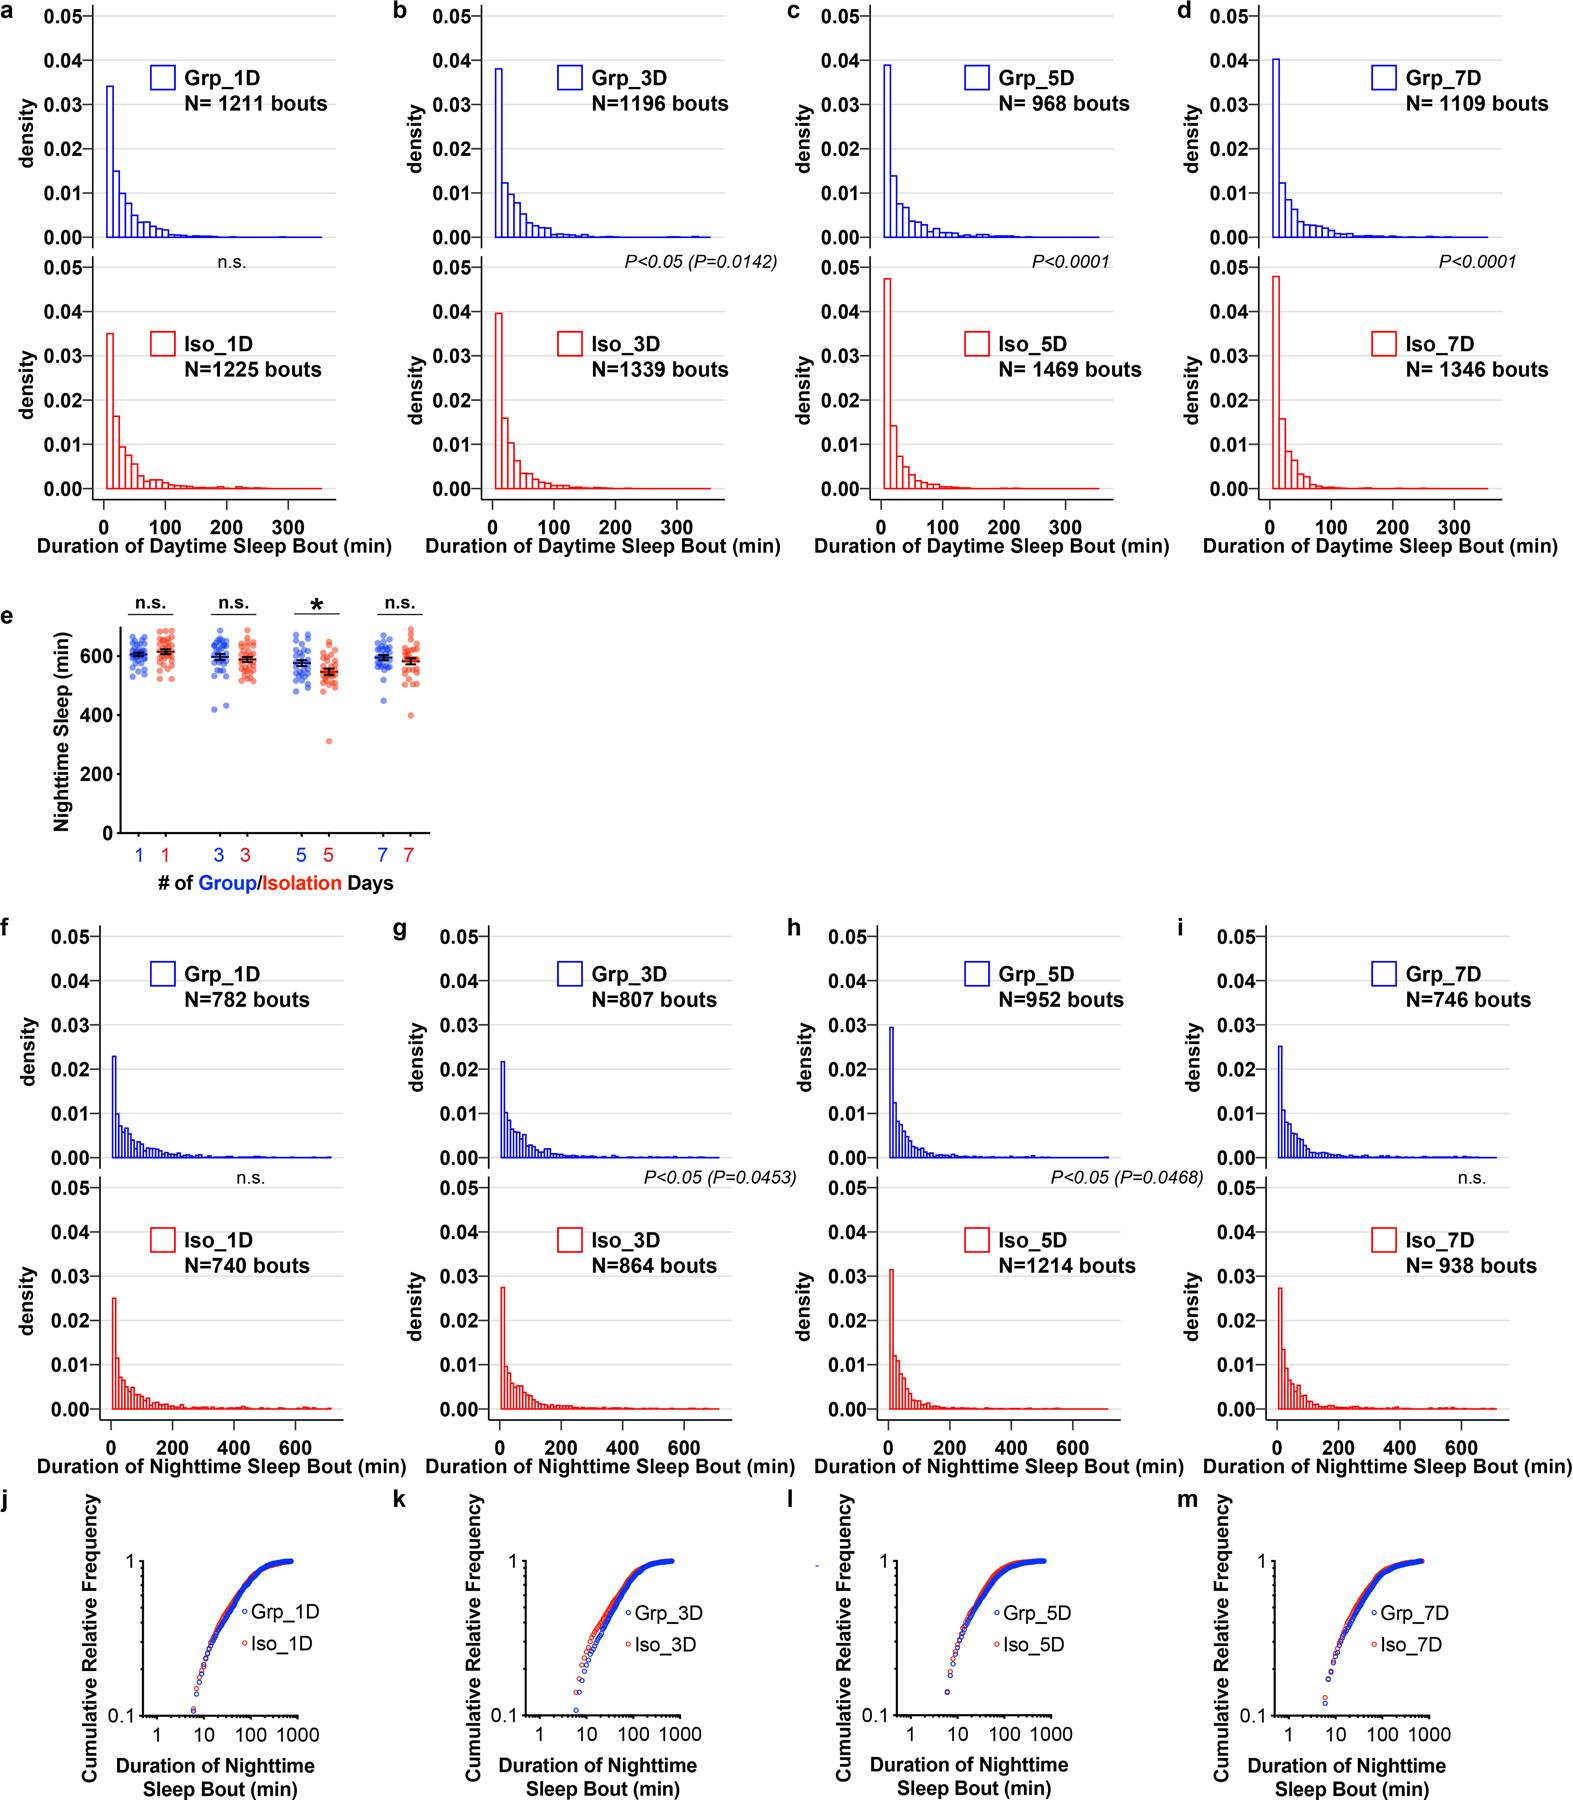
Extended Data Fig. 2. Chronic social isolation does not alter nighttime sleep in wild type Drosophila.

a–d, Density plots for distribution of daytime sleep bouts for flies after 1, 3, 5, 7 days of group enrichment/social isolation. All daytime sleep bouts collected from all animals in each condition were combined. e, Quantification (Mean±SEM with individual data points) of daily nighttime sleep for wild type flies after group enrichment/social isolation for 7 days. f–i, Density plots for distribution of nighttime sleep bouts for flies after 1, 3, 5, 7 days of group enrichment/social isolation. All nighttime sleep bouts collected from all animals in each condition were combined. j–m, Plots of cumulative relative frequency for distributions of nighttime sleep bouts for flies after 1, 3, 5, 7 days of group enrichment/social isolation. Kolmogorov-Smirnov tests were used for comparing distributions. For e, N= 29–32 animals, two-sided unpaired t-test with Welch’s correction; *P<0.05, **P<0.01, ***P<0.001, ****P<0.0001. For N and P values, see the Source Data.
