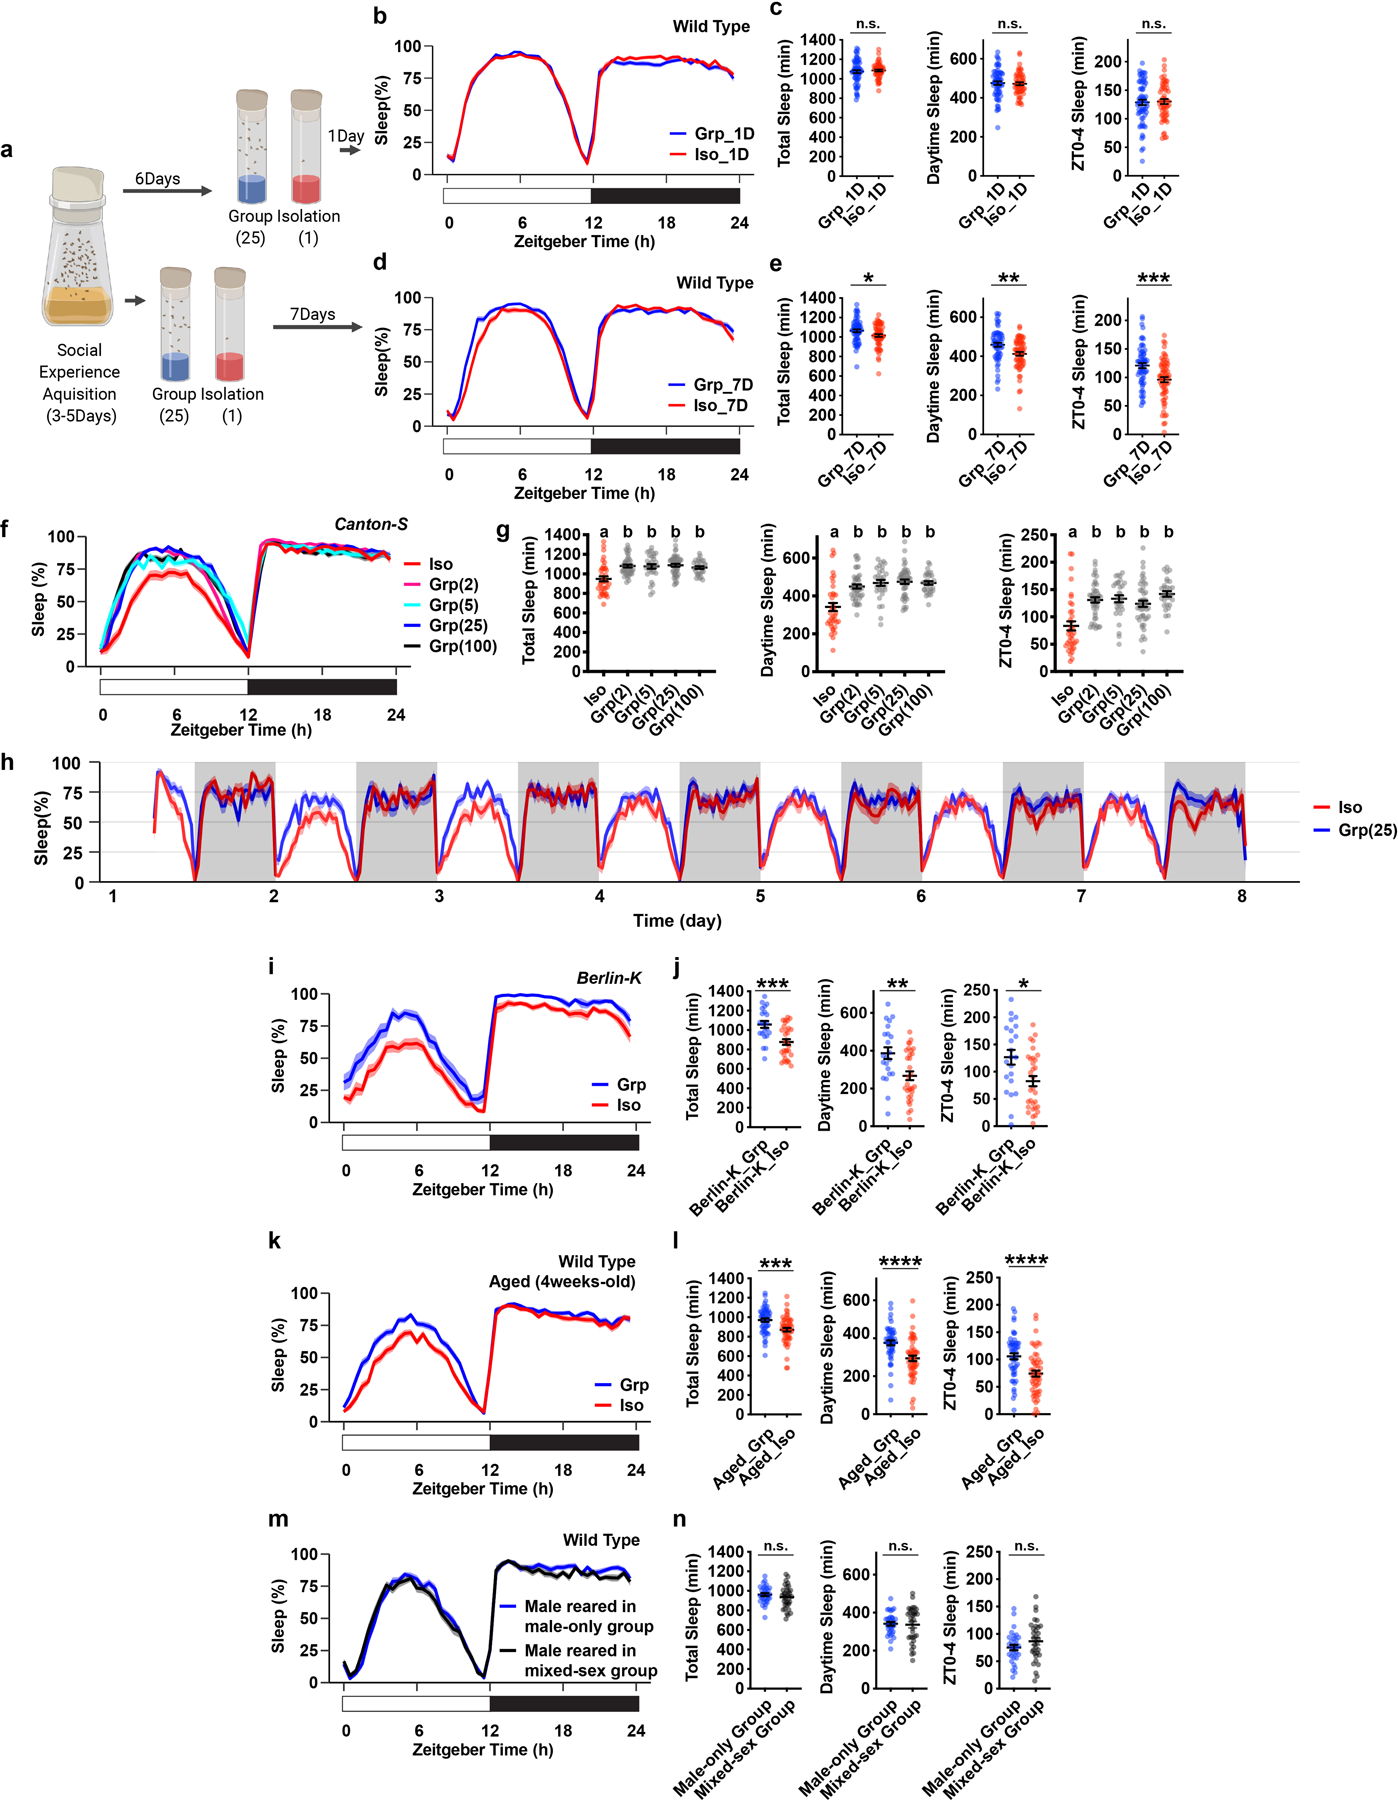
Extended Data Fig. 3. Social isolation reduces Drosophila sleep in age-matched flies, in various isogenic strains, and in aged wild type animals.

a, Schematics of measuring sleep using Drosophila Activity Monitors after 1 or 7 days of group enrichment/social isolation in age-matched flies. b–e, Sleep profile and quantification of daily total sleep, daytime sleep and ZT0-4 sleep after 1 day (b–c, N=55–64 animals) or 7 days of group enrichment/social isolation (d–e, N=61–64 animals). f–g, Sleep profile and quantification of daily total sleep, daytime sleep and ZT0-4 sleep of the Canton-S isogenic strain after social isolation or group enrichment of different group sizes for 7 days (N=30–47 animals). h, A 7-day long sleep profile of flies after group enrichment/social isolation for 7 days. i–j, Sleep profile and quantification of daily total sleep, daytime sleep and ZT0-4 sleep for Berlin-K flies after social isolation/group enrichment (25 flies in a group) for 7 days (N=22–31 animals). k–l, Sleep profile and quantification of daily total sleep, daytime sleep and ZT0-4 sleep of aged wild type flies after group enrichment/social isolation (25 flies in a group) for 7 days (N=52–54 animals). m–n, Sleep profile and quantification of daily total sleep, daytime sleep and ZT0-4 sleep of male wild type flies after group enrichment in a male only group (30 flies in a group) or in a mixed-sex group (15 male and 15 female flies in a group) for 7 days (N=32 animals). Sleep profiles are displayed as the average proportion of time spent sleeping in consecutive 30min segments during a 24hr LD cycle; solid line, Mean; shaded area, ±SEM. Quantifications are displayed as Mean±SEM with individual data points. For g, ordinary one-way ANOVA followed by Tukey’s multiple comparison test; means sharing the same letter are not significantly different. For c, e, j, l and n, two-sided unpaired t-tests with Welch’s correction; *P<0.05, **P<0.01, ***P<0.001, ****P<0.0001. For N and P values, see the Source Data.
