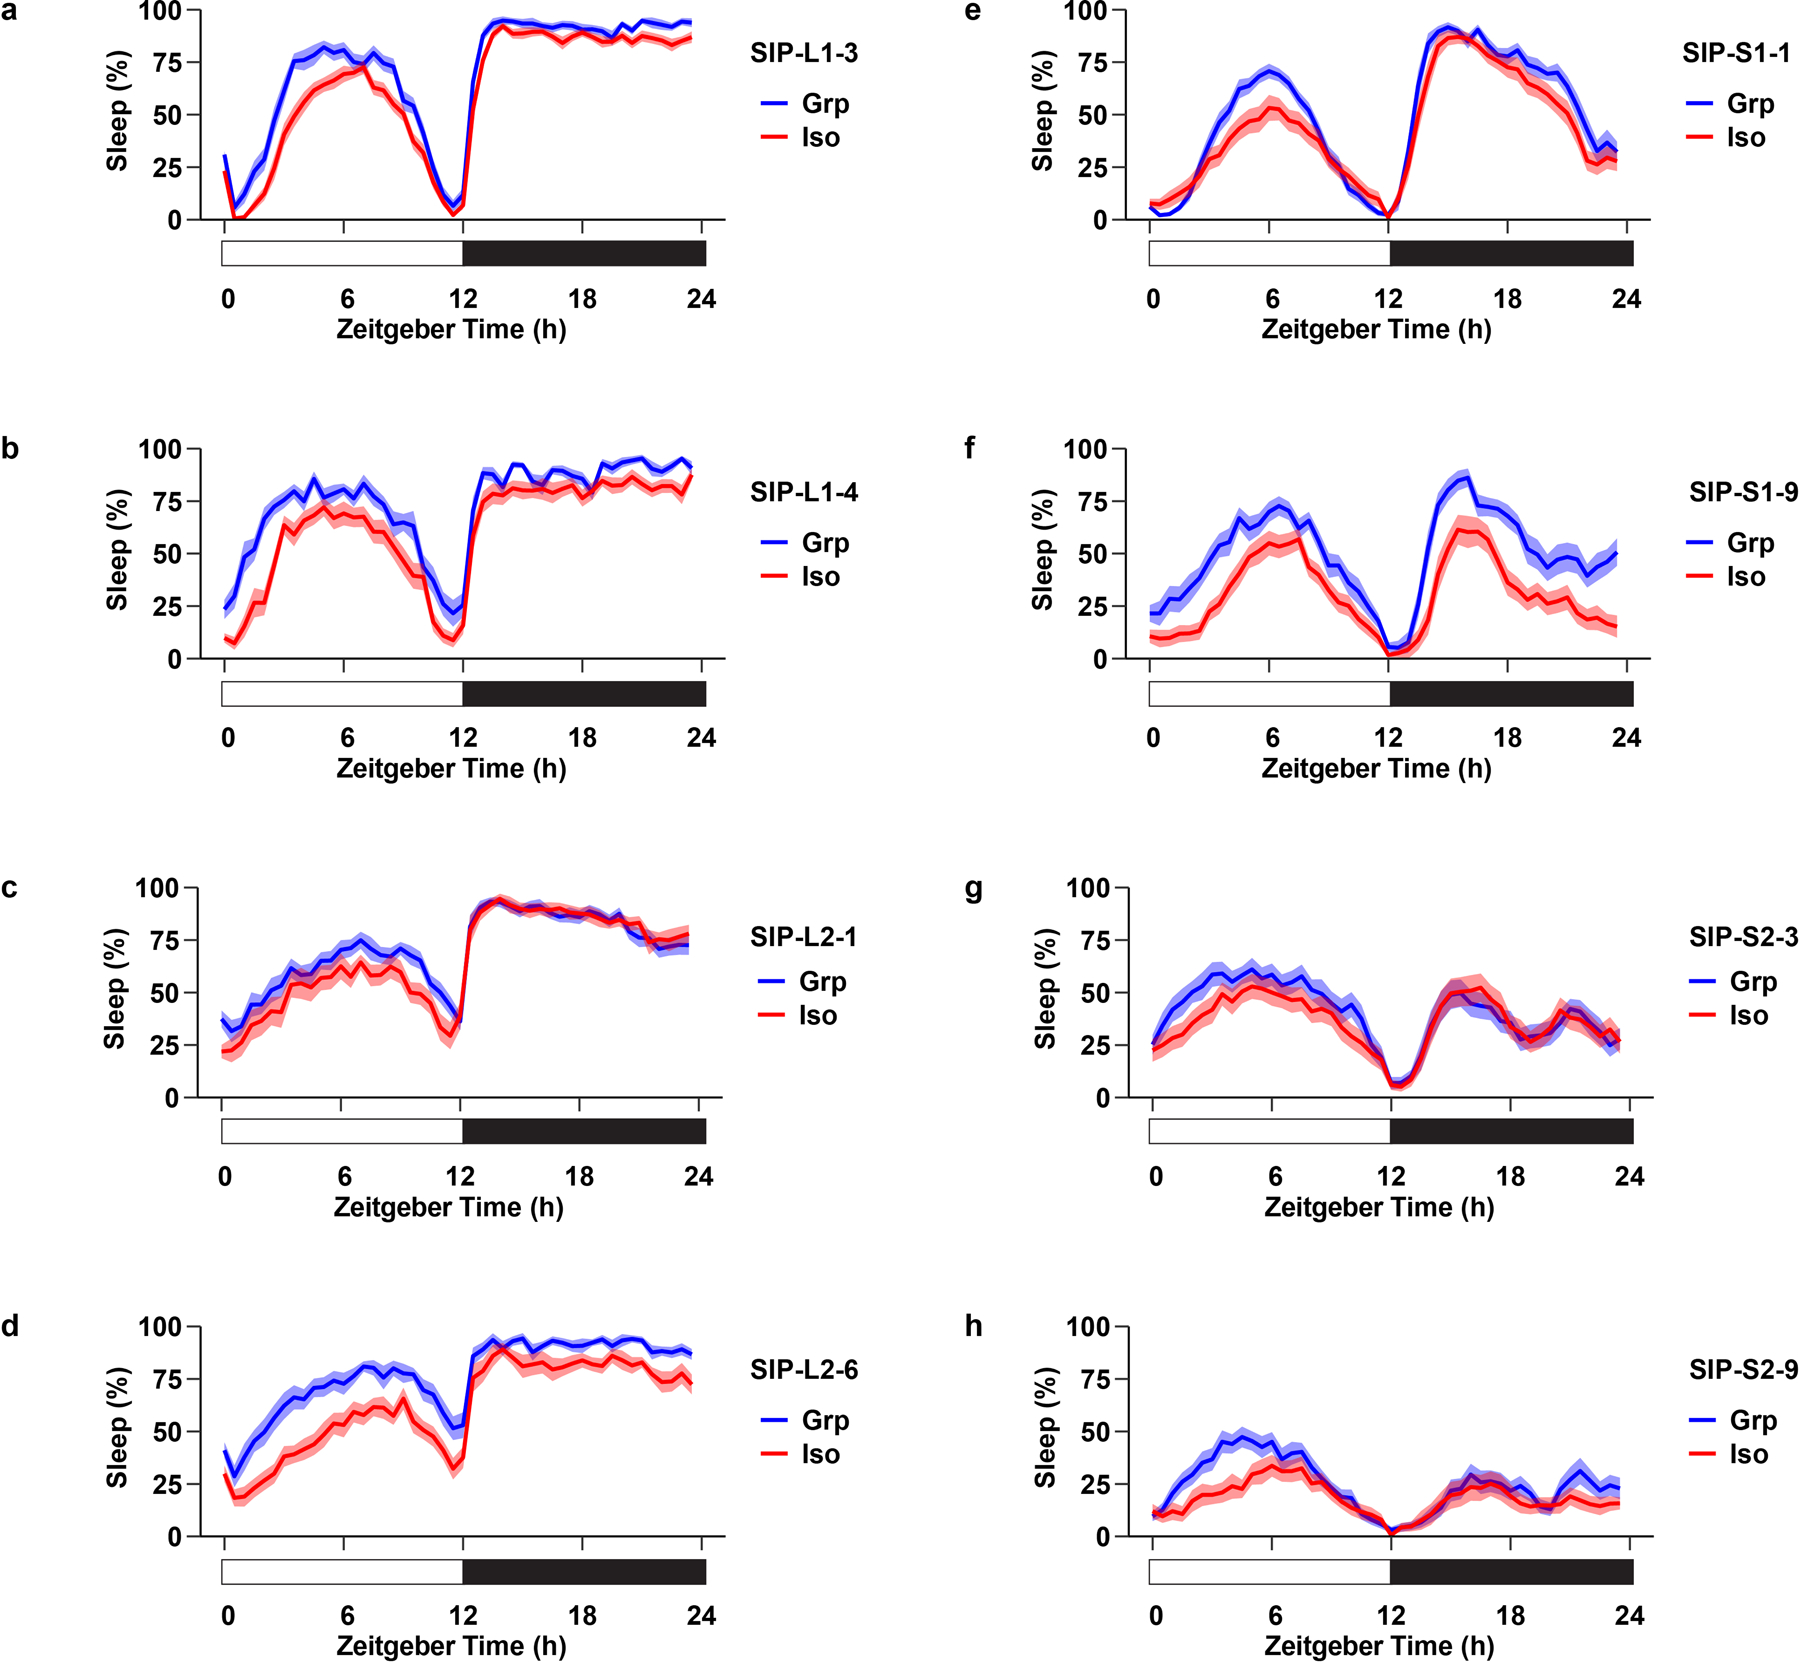
Extended Data Fig. 4. Social isolation reduces sleep in Drosophila Sleep Inbred Panel (SIP) lines.

a–d, Sleep profile of long-sleeping flies: SIP-L1-3 (a), SIP-L1-4 (b), SIP-L2-1 (c), and SIP-L2-6 (d) after group enrichment/social isolation (25 flies in a group for group treatment) for 7 days. e–h, Sleep profile of short-sleeping flies: SIP-S1-1 (e), SIP-S1-9 (f), SIP-S2-3 (g), and SIP-S2-9 (h) after group enrichment/social isolation (25 flies in a group for group treatment) for 7 days. Sleep profiles are displayed as the average proportion of time spent sleeping in consecutive 30min segments during a 24hr LD cycle; solid line, Mean; shaded area, ±SEM. The long-sleeping/short-sleep fly lines were randomly selected from the Sleep Inbred Panel (SIP), a panel of inbred Drosophila melanogaster strains with extreme long or short sleep duration phenotypes35,36.
