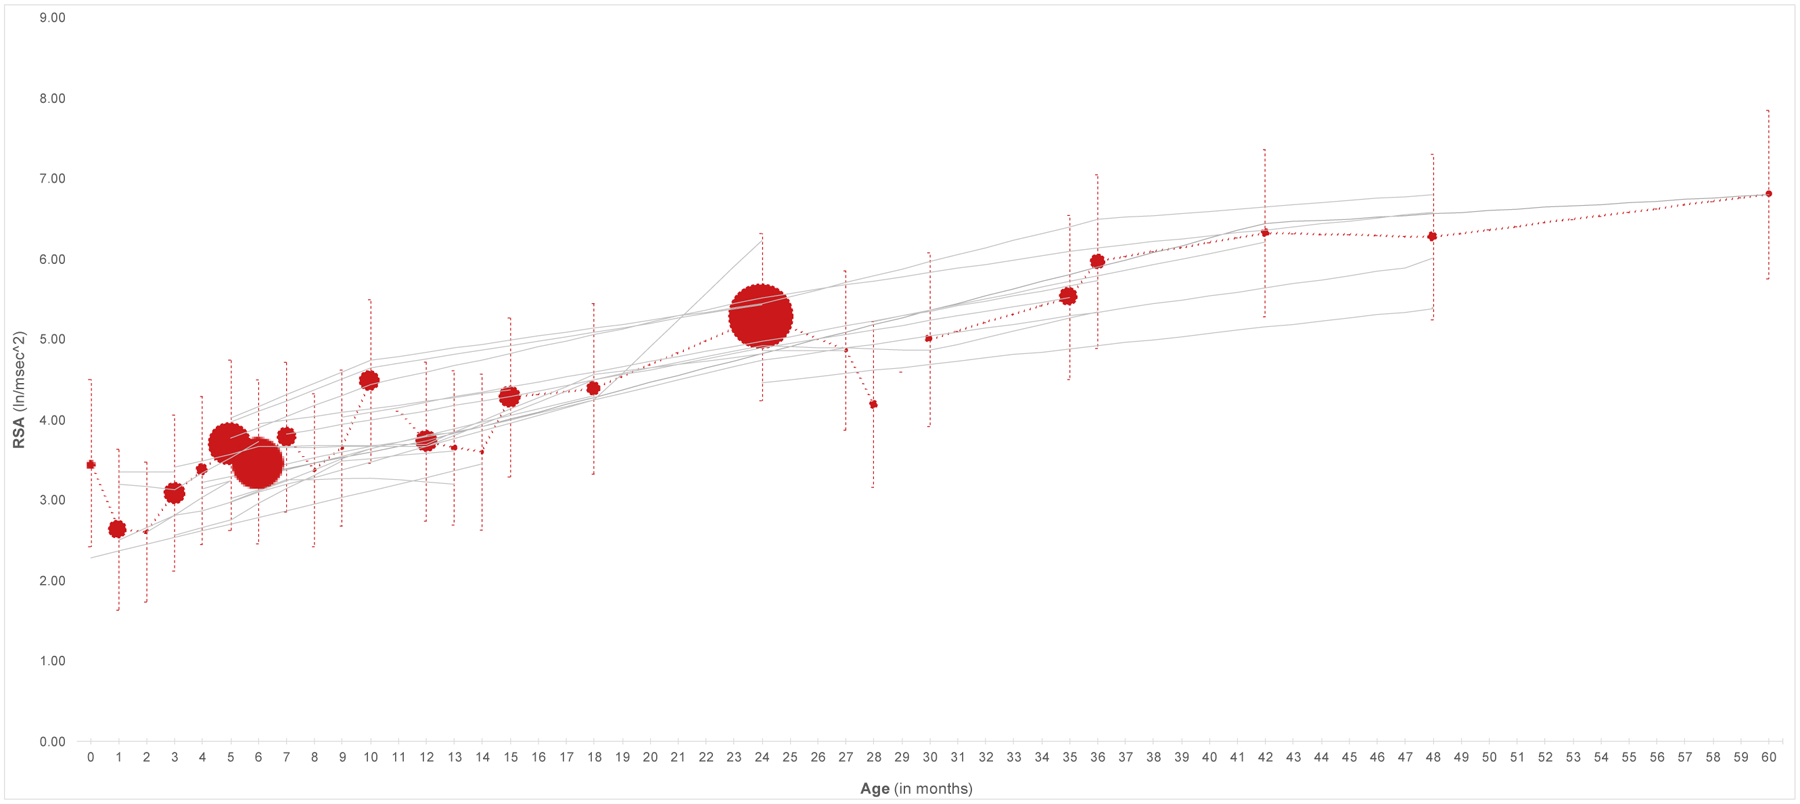
Figure 2.

Graphical summary of studies included in the systematic review. The red line represents the weighted means and pooled standard deviations across studies at each age. The sizes of the red markers are proportionate to the number of studies on which each weighted mean is based. Timepoints reported in Table 1 were used to locate each study on the x-axis. When a range of timepoints were provided, the mid-point of that range was used (except for Waters et al. (2016), which was omitted from the figure due to the width of the range). For Riniolo et al. (1997), the sub-sample with higher temperatures is depicted; for Sullivan et al. (2016) the children who participated in the study on day 1 are included.
