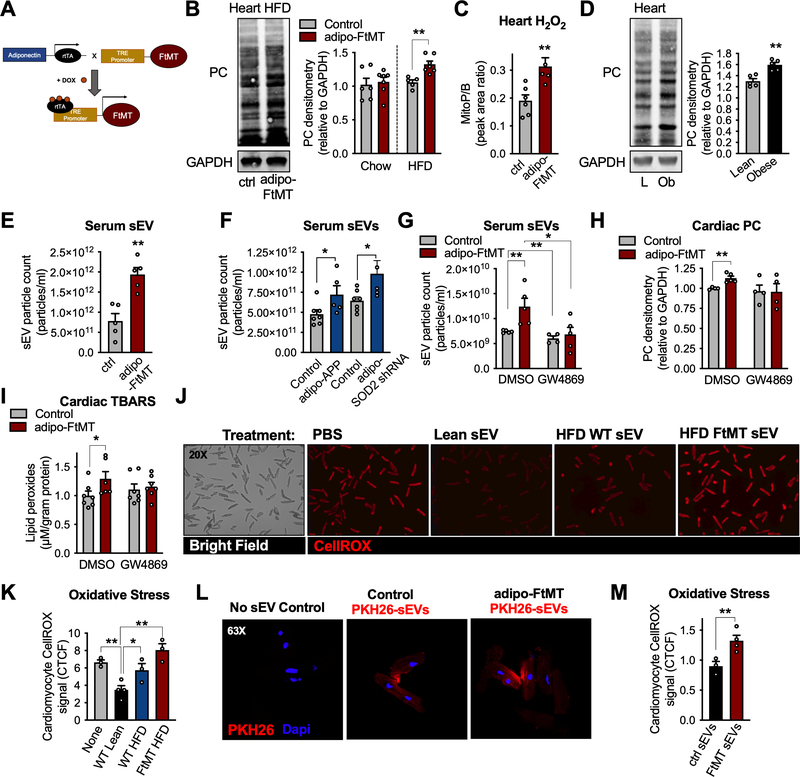
Figure 1: Adipocyte-specific mitochondrial dysfunction induces mitochondrial oxidative stress in the heart via extracellular vesicles.
A, Mouse model schematic of adipocyte-specific, doxycycline (dox)-inducible overexpression of mitochondrial ferritin (FtMT). B, cardiac protein carbonylation (PC) assay, representative of n = 5, and quantification. Adipo-FtMT PC levels were normalized to their controls on respective diets so no comparisons can be made between dox-chow and dox-HFD. C, MitoB/P measurements in cardiac tissue following 3 weeks dox-HFD. D, PC measurements in cardiac tissue from lean and obese mice (20 wk HFD) E, Serum sEV quantification following 3 weeks of dox-HFD. F, Serum sEV count from adipo-APPβ or adipo-SOD2 shRNA mice on dox-HFD diet for 2 weeks. G-I, Control and adipo-FtMT mice were placed on dox-HFD for 4 hours and given an injection of either DMSO or GW4869. J and K, representative microscopy images and quantification (corrected total cell fluorescence; CTCF) of isolated cardiomyocytes stained with CellROX following 2 hours of sEV treatment as indicated. L, A representative confocal image and quantification of PHK26-labeled adipocyte-derived sEV uptake by mature cardiomyocytes in vitro. M, Quantification of CellROX signal in isolated cardiomyocytes 2 hours post sEV treatment as indicated. Data are presented as mean ± s.e.m. *P < 0.05, ** P < 0.01. See also Figure S1 and S2.

