Fig. 5.
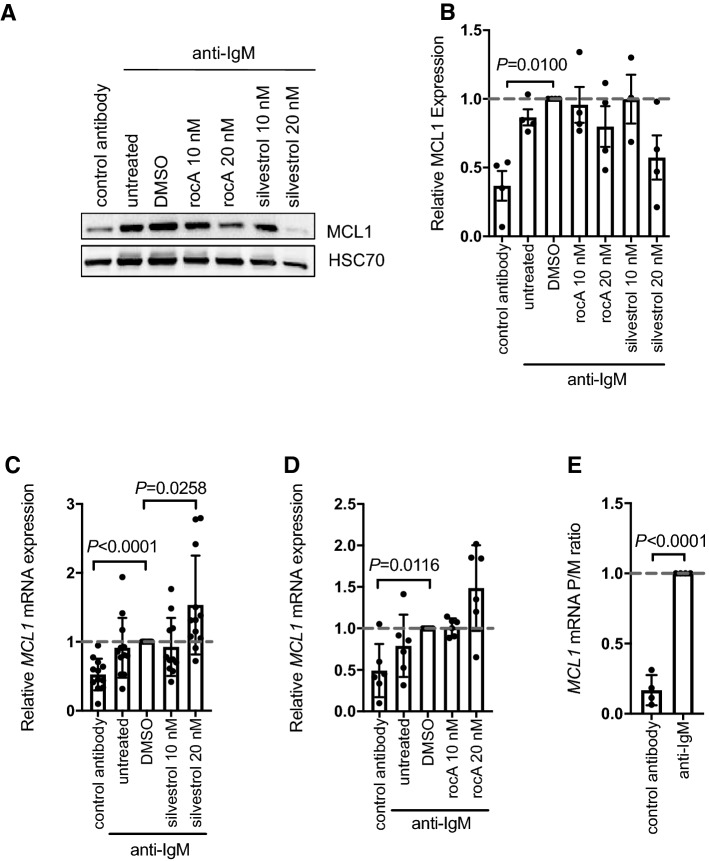
Effect of eIF4Ai on anti-IgM-induced MCL1 protein and mRNA expression. CLL samples were pre-treated with silvestrol, rocA or DMSO (solvent control) or left untreated for 1 h and then incubated with anti-IgM for 24 h. Samples were also treated with control antibody. After 24 h expression of (A, B) MCL1 and HSC70 (loading control) was analyzed by immunoblotting. Figure A shows representative immunoblot and (B) quantification of all samples analyzed (n = 4). C, D Expression of MCL1 mRNA was quantified by Q-PCR for c silvestrol (n = 12) or D rocA-treated cells (n = 6). Student’s t tests were performed to determine the statistical significance of differences between test conditions and DMSO/anti-IgM-treated cells (where not shown, P > 0.05). E Polysome profiling of MCL1 mRNA (n = 4). Graphs show values for individual samples and mean (± SD) expression of polysome/monosome (P/M) ratio with values for DMSO/anti-IgM treated cells set to 1.0. A Student’s t test was performed to determine the statistical significance of differences between control antibody and anti-IgM-treated cells

