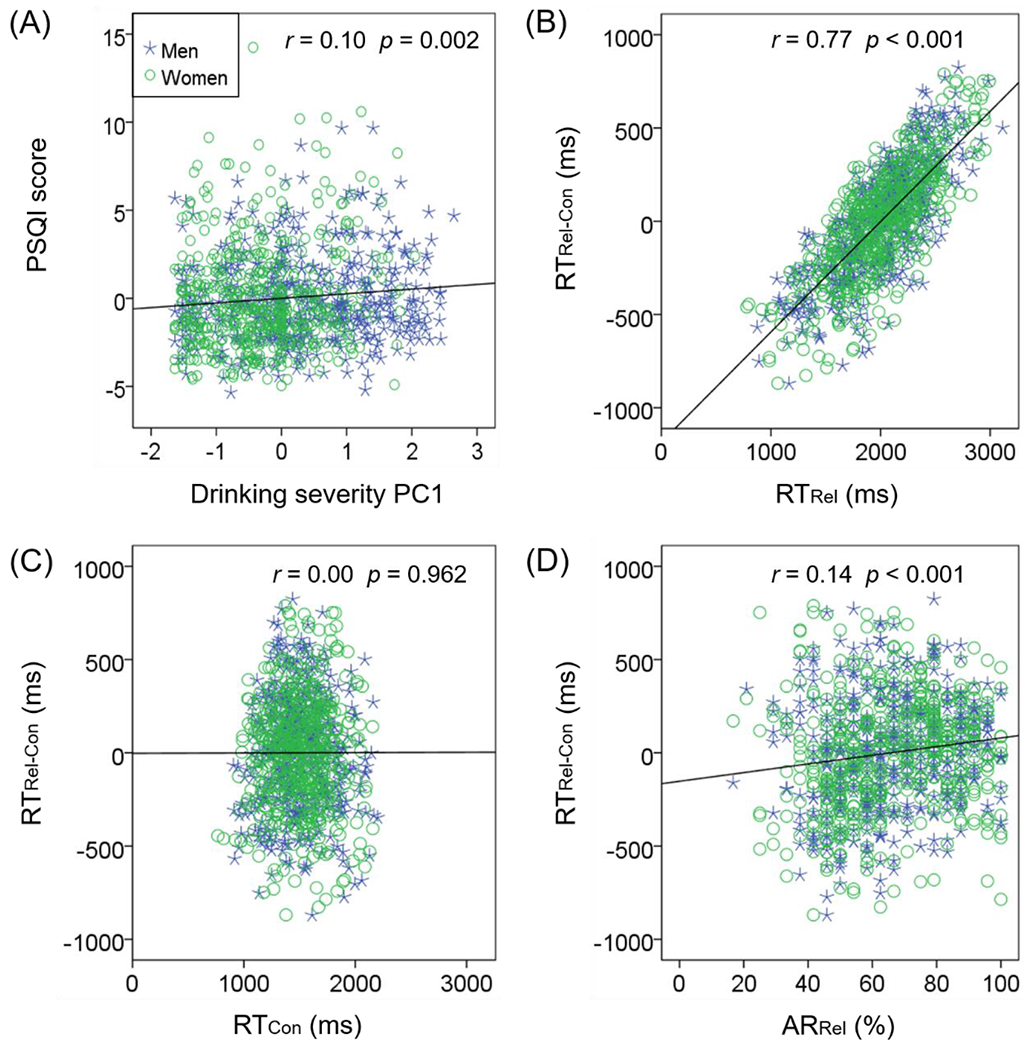
Figure 1.

Scatter plots of the correlation between clinical and relational task performance variables. Data points are shown for men (blue asterisk) and women (green circle) separately. Men and women did not differ in the slopes of regressions; thus, the regression lines (black) show the correlations across all subjects. (A) PSQI score and drinking PC1 were positively correlated; RTRel-Con were positively correlated with RTRel (B) but not with RTCon (C); RTRel-Con was positively correlated with ARRel (D). Note that residuals are plotted here with age, sex, and years of education accounted for in the regressions.
