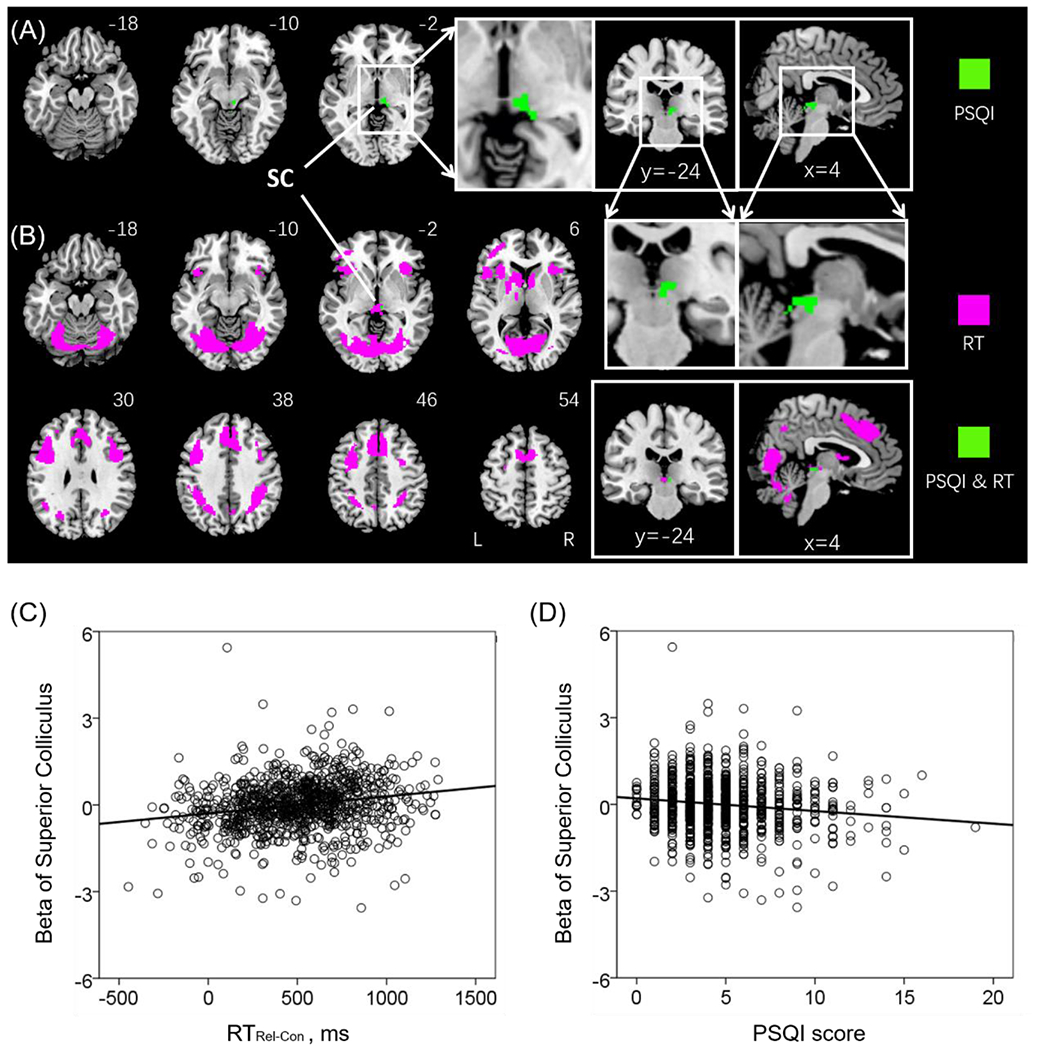
Figure 2.

(A) One cluster comprising the pulvinar and superior colliculus (SC) showed negative correlation with PSQI (highlighted in green). (B) A number of clusters showed positive correlation with RTRel-Con (magenta); and one cluster, located in the SC, showed positive correlation with RTRel-Con and negative correlation with PSQI (green). Linear regression of (C) beta estimates of the SC vs. the difference in RT between relational and control blocks or RTRel-Con (D) beta estimates of SC vs. the PSQI score. Note that the scatter plots show the residuals, after age, sex, and years of education were accounted for. Clusters are overlaid on a T1 structural image in neurological orientation: right = right. The inset shows sagittal/coronal sections to highlight the cluster in the SC.
