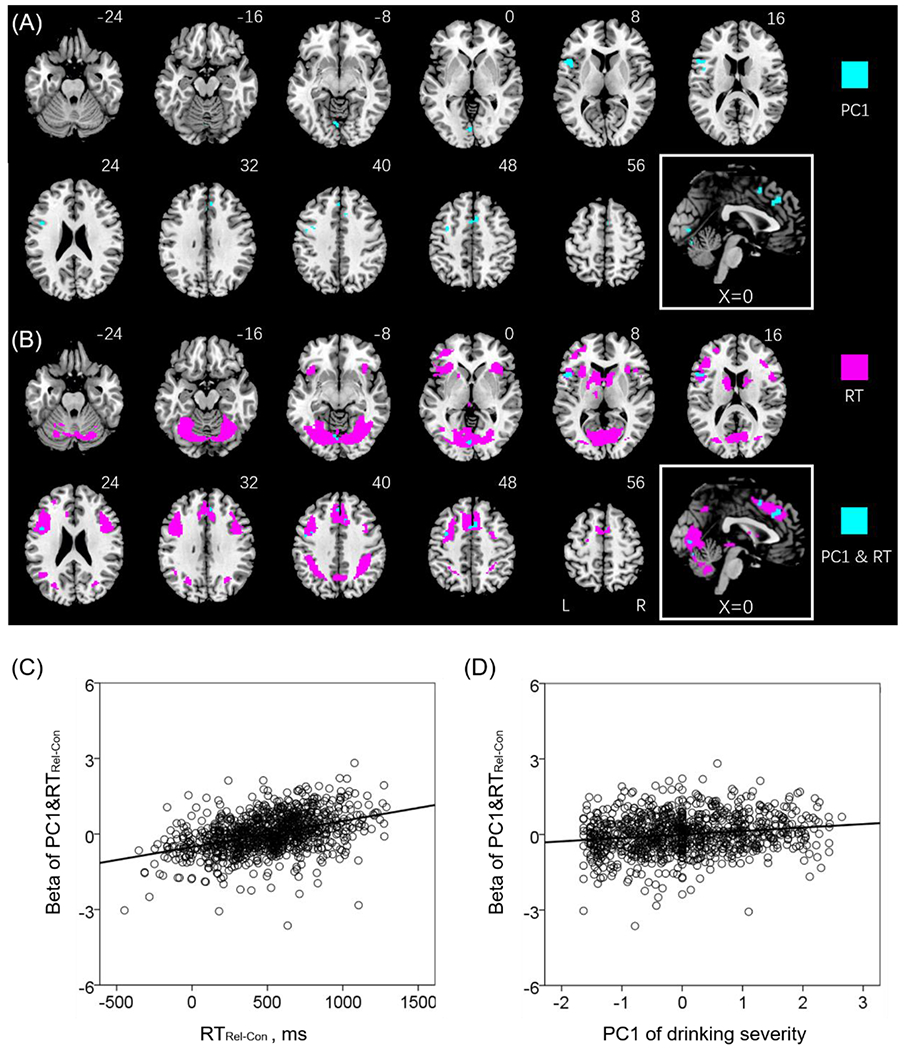
Figure 3.

A number of clusters showed activities in positive correlation with PC1 (A), highlighted in cyan, and with RTRel-Con (B), highlighted in magenta. The voxels showing positive correlation both with RTRel-Con and PC1 were also highlighted in cyan in (B). Linear regression of (C) beta estimates of the overlapping voxels (PC1&RT) vs. the difference in RT between relational and control blocks (RTRel-Con) (D) beta estimates of PC1&RT vs. PC1. Note that the scatter plots show the residuals, after age, sex, and years of education were accounted for. Clusters are overlaid on a T1 structural image in neurological orientation: right = right. The inset shows a mid-sagittal section to highlight the clusters in the middle cingulum and supplementary motor area cortex.
