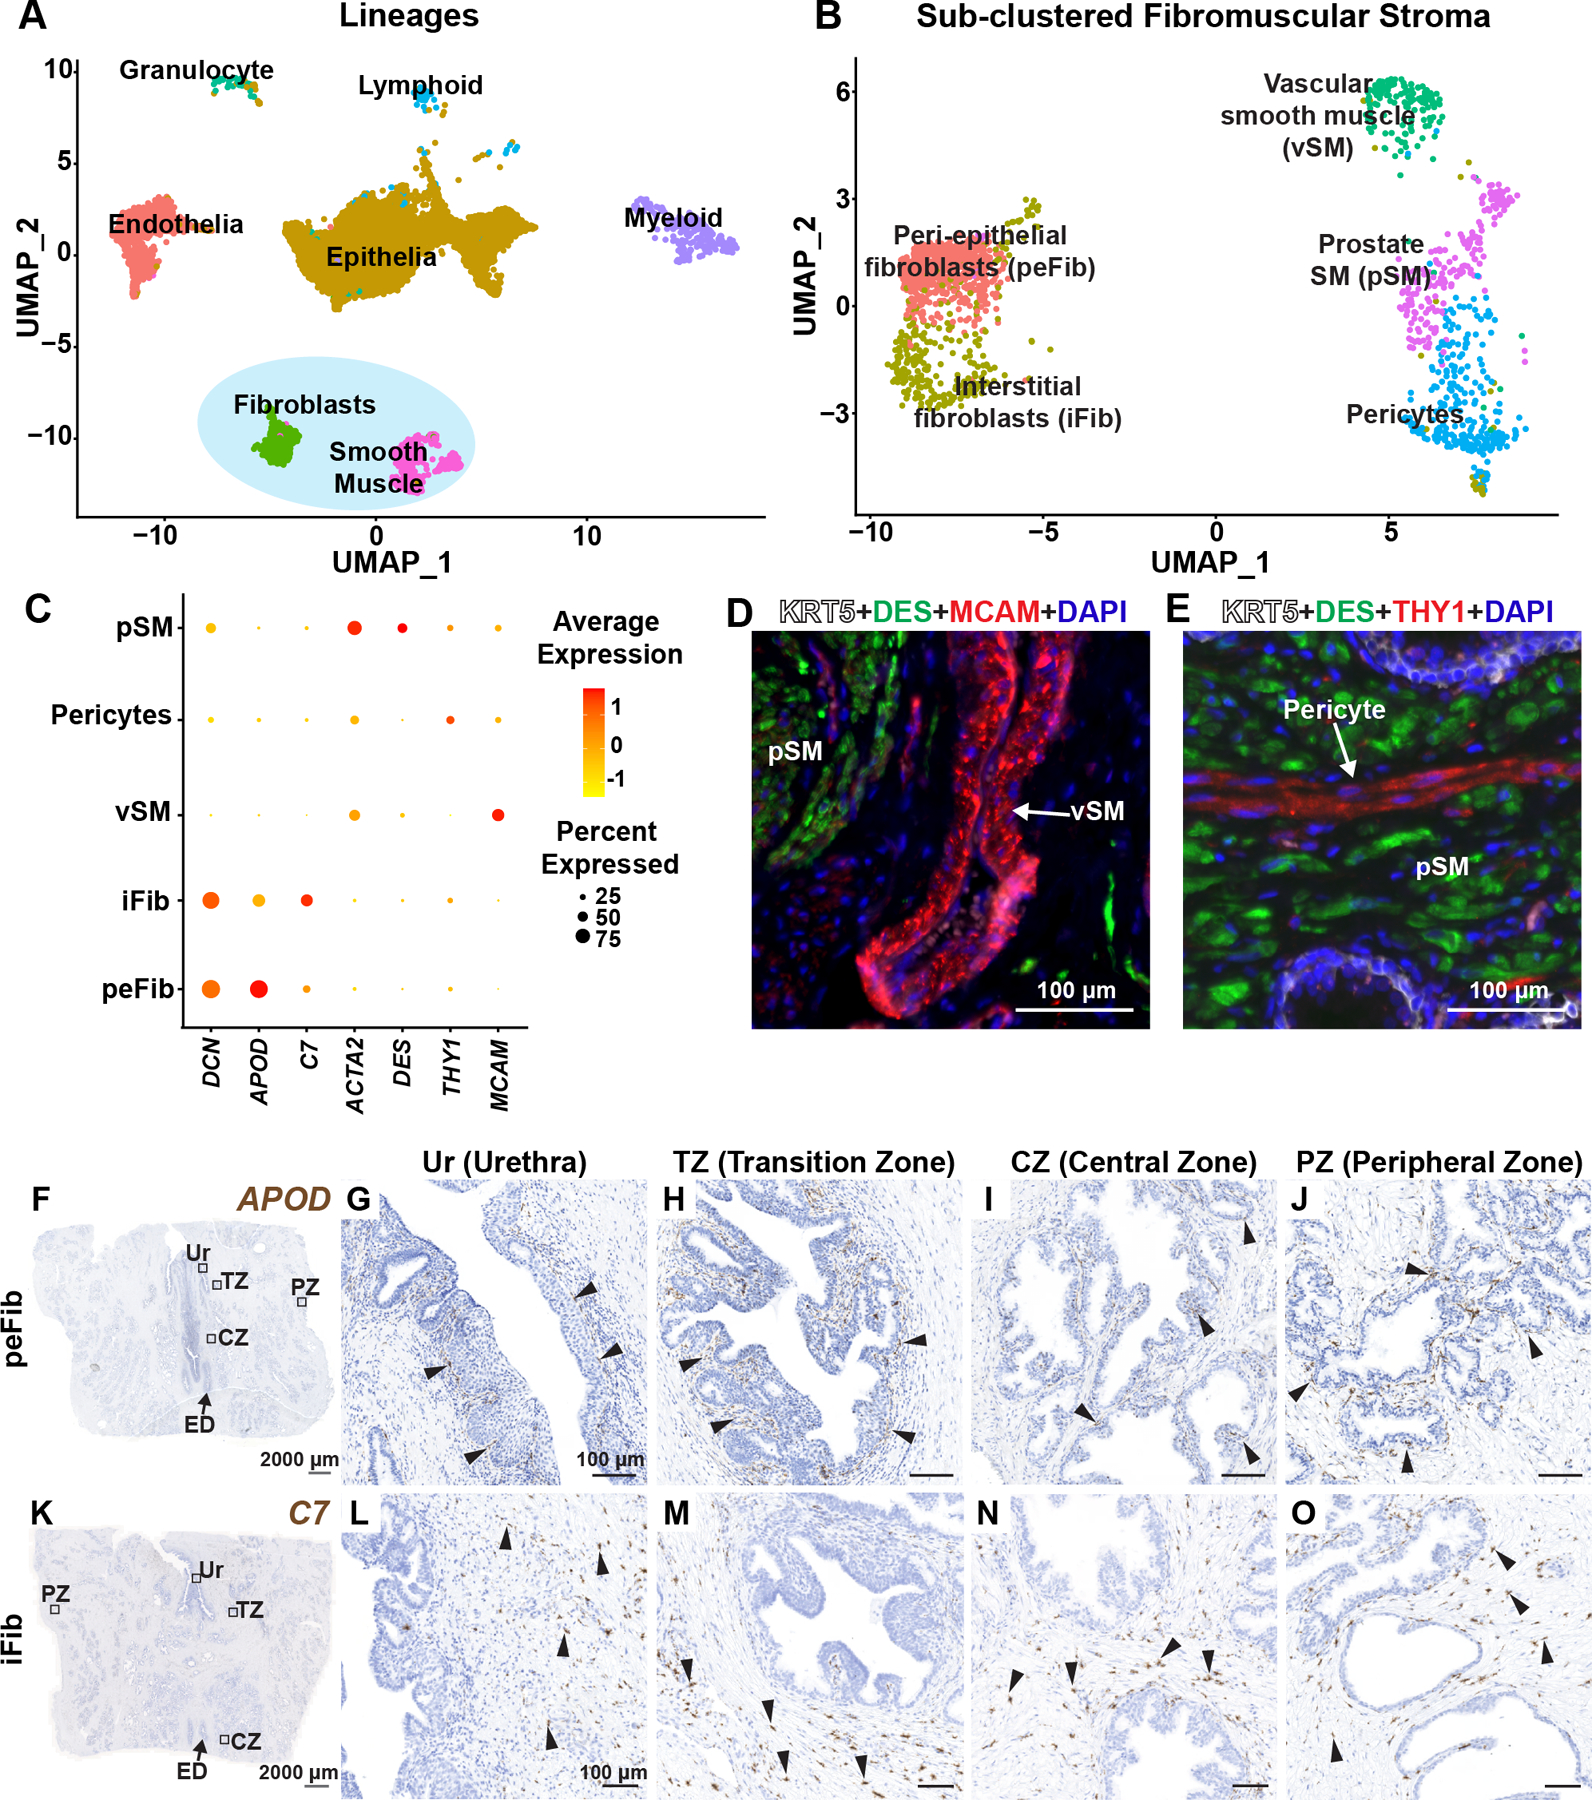
Figure 1. Identification and validation of fibromuscular stroma subtypes in the human prostate.

(A) Clustering of major cell lineages in normal human prostate samples (n=3 prostate donors). (B) Subsetted fibromuscular stroma from normal human prostate samples (n=3 prostate donors). (C) Dot plot of selected differentially expressed marker genes across each fibromuscular stromal subtype. (D) Section through prostate tissue labeled with fluorescent antibodies to the prostate smooth muscle marker DES (in green), vascular smooth muscle marker MCAM (in red) and basal epithelial marker KRT5 (in white). (E) Section through prostate tissue labeled with fluorescent antibodies to the prostate smooth muscle marker DES (in green), Pericyte marker THY1 (in red) and basal epithelial marker KRT5 (in white). DAPI (in blue) labeled nuclei. (F) Section through prostate tissue from organ donor labeled with probes to the peri-epithelial fibroblast marker APOD (in brown). Magnified images of distinct anatomical locations from (F) corresponding to (G) Urethra, (H) Transition zone, (I) Central zone and (J) Peripheral zone. (K) Section through prostate tissue from organ donor labeled with probes to the interstitial fibroblast marker C7 (in brown). Magnified images of distinct anatomical locations from (K) corresponding to (L) Urethra, (M) Transition zone, (N) Central zone and (O) Peripheral zone. Black arrowheads indicate individual fibroblasts. Grey scale bar represents 2000 microns. Black scale bar represents 100 microns. See also supplementary material, Figure S1.
