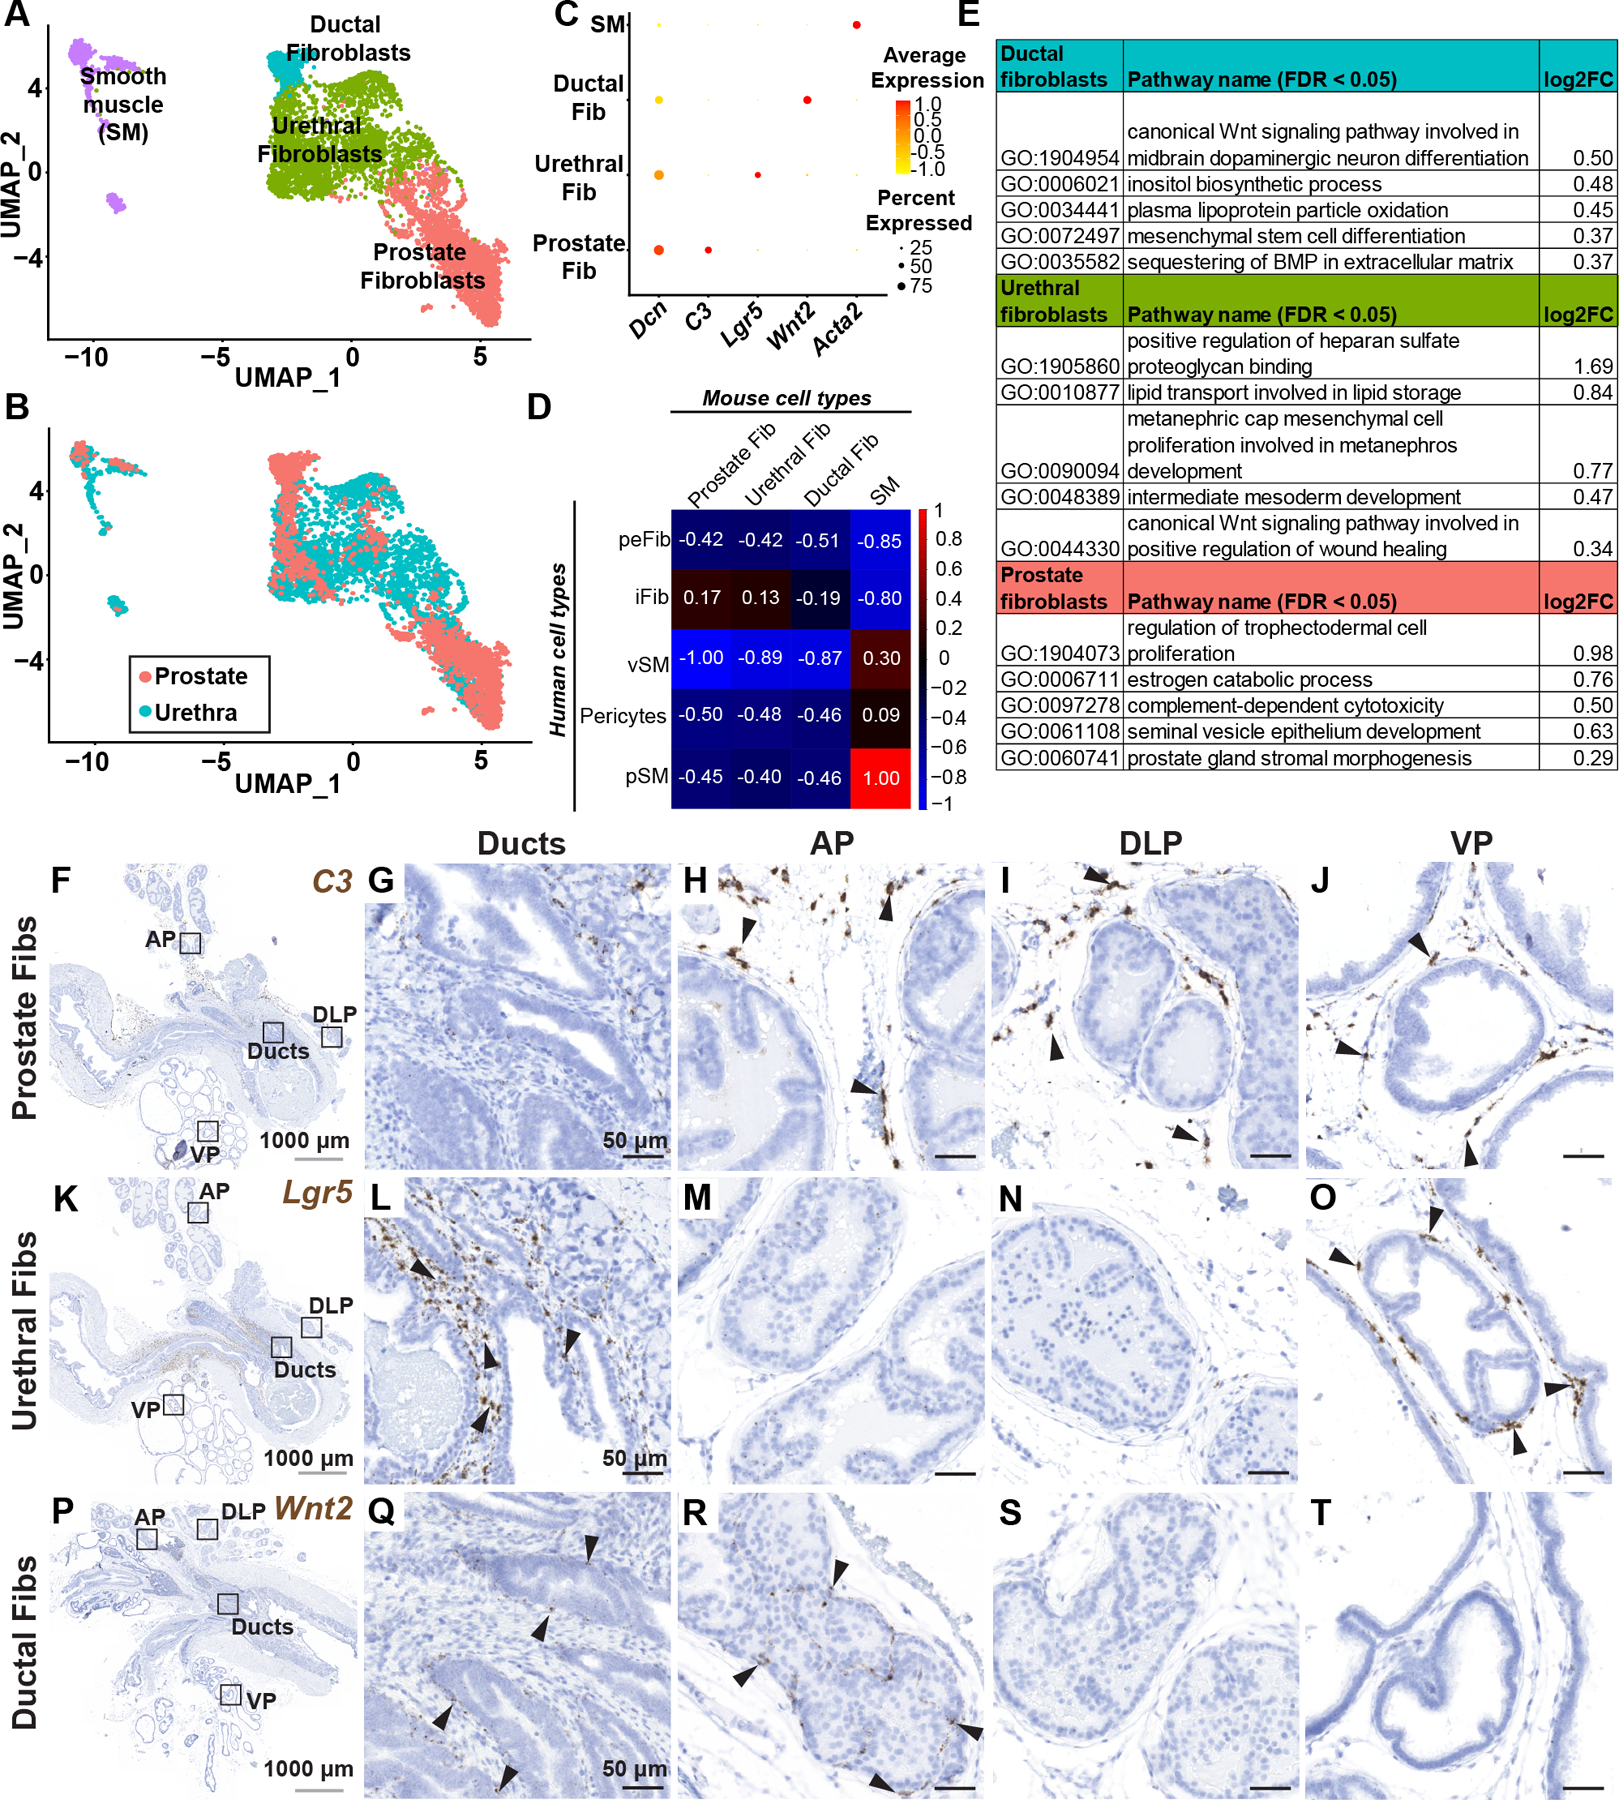
Figure 2. Identification and validation of fibromuscular stroma subtypes in the mouse prostate and prostatic urethra.

(A) Clustering of subsetted fibromuscular stroma from adult mouse prostates (n=4 mice) and prostatic urethras (n=4 mice). (B) Subsetted fibromuscular stroma from adult mice displaying contribution from prostate and prostatic urethra samples. (C) Dot plot of selected differentially expressed marker genes across each fibromuscular stromal subtype. (D) Pearson correlation of human (genes converted to mouse orthologs) and mouse fibromuscular stromal subtypes. Correlation coefficients are globally scaled between 1 and −1. (E) Quantitative Set Analysis for Gene Expression (QuSAGE) performed on mouse fibroblast subtypes. Selected significantly upregulated gene sets (false discovery rate < 0.05) displayed with log2 fold-change values. (F) Sagittal section through adult mouse lower urinary tract labeled with probes to the prostate fibroblast marker C3. (G–J) Magnified regions corresponding to distinct anatomical locations in (F). (K) Sagittal section through adult mouse lower urinary tract labeled with probes to the urethral fibroblast marker Lgr5. (L–O) Magnified regions corresponding to distinct anatomical locations in (K). (P) Sagittal section through adult mouse lower urinary tract labeled with probes to the ductal fibroblast marker Wnt2. (Q–T) Magnified regions corresponding to distinct anatomical locations in (P). Black arrowheads indicate individual fibroblasts. Grey scale bar represents 1000 microns. Black scale bar represents 50 microns. See also supplementary material, Figure S2.
